
Expectations Investing: a fundamental book on stock valuation
Review & summary

When I just started investing, I had absolutely no idea how to pick stocks. My notion was “buy great businesses”. Then I understood that a great business does not mean “the stock is guaranteed to rise”, so we need to find companies that that are unjustly out of favor but are going to shine again. Okay… but how?
Business websites bombard us with info about new products, competitive dynamics, P/E ratios, analyst forecasts. Twitter adds to the confusion with ardent posts about new high-conviction bets. How to make sense of this noise?
I found the answer in “Expectations Investing: Reading Stock Prices for Better Returns”, written by Michael J. Mauboussin and Alfred Rappaport.

Quick review
The book provides an elegant and convincing framework for active investing. Even if you eventually decide that expectations investing is not your style, it’s still very much worth reading just for the sake of sharpening overall market understanding.
The updated edition (2021) is quite contemporary. It describes, among other things, a useful approach to evaluating high-growth, unprofitable companies.
The language is simple and clear enough; the necessary terminology is explained or understandable from context. However, the authors are academically precise and careful. It is generally a good thing, but they do not share many heuristics that would be helpful for internalizing the material. This is definitely a book that requires an intensive thought process on the reader’s side.
That is why in the rest of the post I will do a quick (and very much oversimplified) summary of the core idea to help you grasp the intuition. I am writing the article I would like to read myself before starting the book.
The core idea: stock prices are based on expected future cash flows
The authors argue that market prices stocks just like any other asset. Prices are always based on the present value of future returns. It is easy to see when you think about bonds: the cash flows are predictable. Working with stocks means much more uncertainty, but the basic principle is the same. The way to deal with uncertainty is to make a rigorous reality check of market expectations baked into price:
Expectations investing is based on two simple ideas: First, you can read stock prices and estimate the expectations that they imply. Second, you will earn superior returns only if you correctly anticipate revisions in those price-implied expectations.
How to estimate expectations that stock prices imply
The core concept here is shareholder value. To get shareholder value, we need to:
Get free cash flow (the money actually available to pay out to shareholders in a given year).
Calculate corporate value: present value of this future free cash flow. Just like the present value of getting $100 a year later (assuming the risk-free rate is 5%) =100/(1+0.05) = $95.2; the corporate value = free cash flow/rate of return expected by the market.
We’ve already done the heavy lifting: to turn corporate value into shareholder value, we simply need to add nonoperating assets and subtract liabilities.
Back to estimating expectations. We need to construct a model: how the company can reach the level of shareholder value per share that equals the current price?
Here is the example from the book:
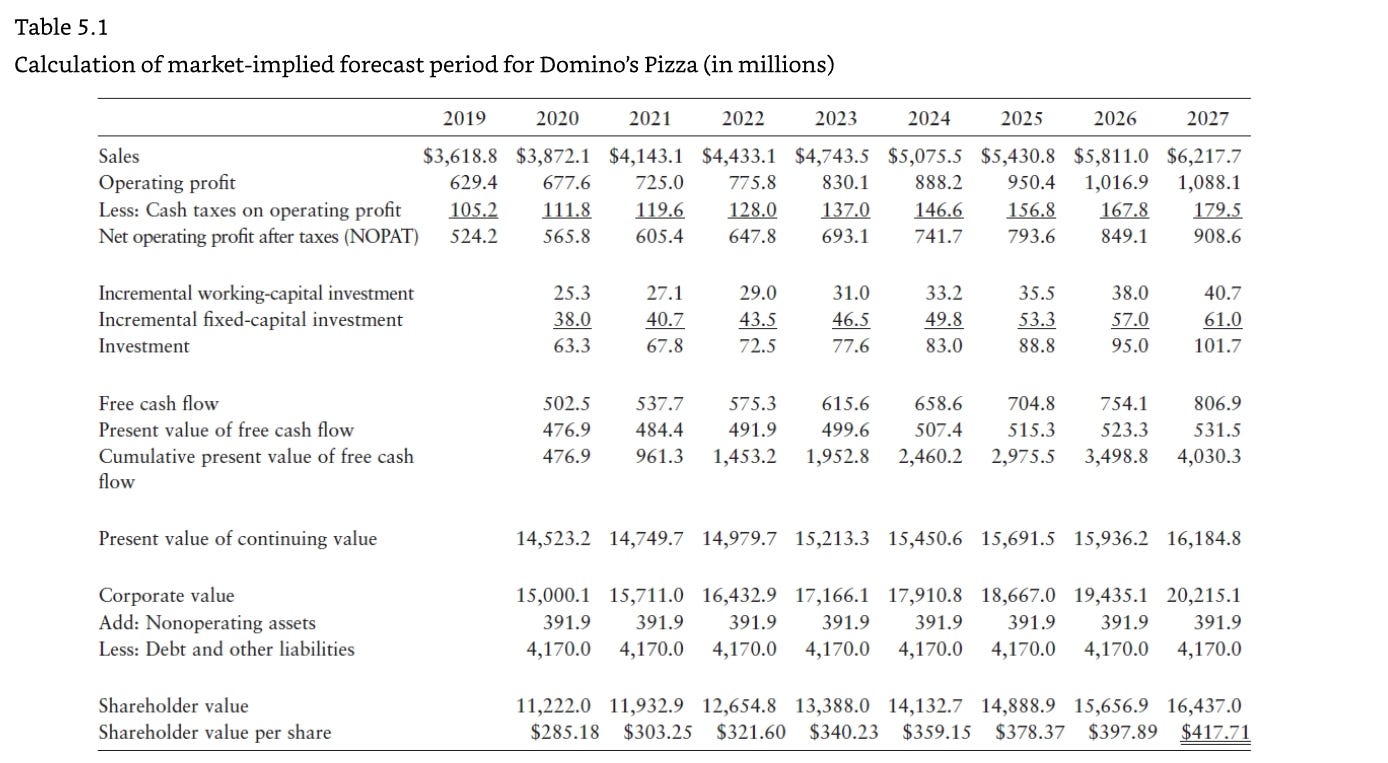
Looks intimidating, but the logic is simple: we reconcile the company’s performance with the actual stock price. The authors stress that we do not need to forecast the exact future cash flows: we need to focus on drawing a plausible way the company will generate enough value to justify the current price. And then we need to attack this plausible way as a devil’s advocate!
If all the plausible scenarios of reconciliation collapse — we might have spotted a mispricing and an opportunity.
Still too abstract? No problem, here is an example. Please note, the calculations and assumptions are rough and dirty — just an illustration of the logic.
Google’s share price at the end of April 2025: $150 (after another dip). From the February 10-K we can get:
Net operating profit after taxes: 94B.
Weighted-average diluted shares: 12.447B.
So the market cap is 12.447B×150 = 1.87T. Let’s draw a plausible way to justify the current price. How do we reach this amount of shareholder value?
Well, one of the ways is to imagine Google as a stable and slow-growing company — a tech equivalent of Procter & Gamble. All we need is 3% growth with a market-average cost of capital is 8%. Assuming that, we can get the present value of the company by discounting the cash flows by 5% (8% - 3%).
Let’s calculate the next year’s cash flow: 94B×1.03 = 96.82B.
And now the discounting itself:
Present value = 96.82B/0.05 = 1.94T.
Wow. 1.94T > 1.87T. The assumed slow growth is more than enough to justify the current price.
Note that we can use different scenarios to explain the pricing. We can build a model with a gradual declining in growth, for example. We can take into account current cash reserves and obligations. What matters is the gap between these models and business reality. In the case of Google, all roads lead to Rome: every scenario implies near-stagnation.
How to anticipate revisions in price-implied expectations (PIE)
Here is the 3-step process the authors recommend for identifying revisions.
Step 1: Estimate High and Low Values for the Sales Trigger and Calculate the Shareholder Values That Result
We begin with the sales trigger because revisions in sales are likely to produce the most significant changes in shareholder value. Starting with sales also allows you to quickly determine whether you should spend time on the other two value triggers, operating costs and investments. This substantially reduces your analytical effort because you focus on what matters.
To estimate the impact of the sales trigger on shareholder value, you first need to estimate a range of sales growth rates, including high and low scenarios. Use the benchmark data (historical performance and PIE) and analytical tools (the expectations infrastructure and competitive strategy analysis) to create these forecasts.
In case of Google sales were indeed the turbo trigger. The price-implied expectations were in a stark contrast with Google’s actual performance in previous years (double-digit growth). The market priced in AI disruption of search and disregarded growing and wide-moat sectors of Google’s business like Cloud and YouTube. On top of that, Google has fast-developing AI services and enough resources to sustain them.
Any forecast based on historical performance shows that shareholder value is significantly higher than the market cap. So if we believe that fears of AI disruption are overestimated, Google at $150 per share is significantly underpriced.
All the company needed to do was to keep the current pace of growth and show that the main revenue stream — paid search clicks — is not disrupted just yet. The market quickly recognized that:
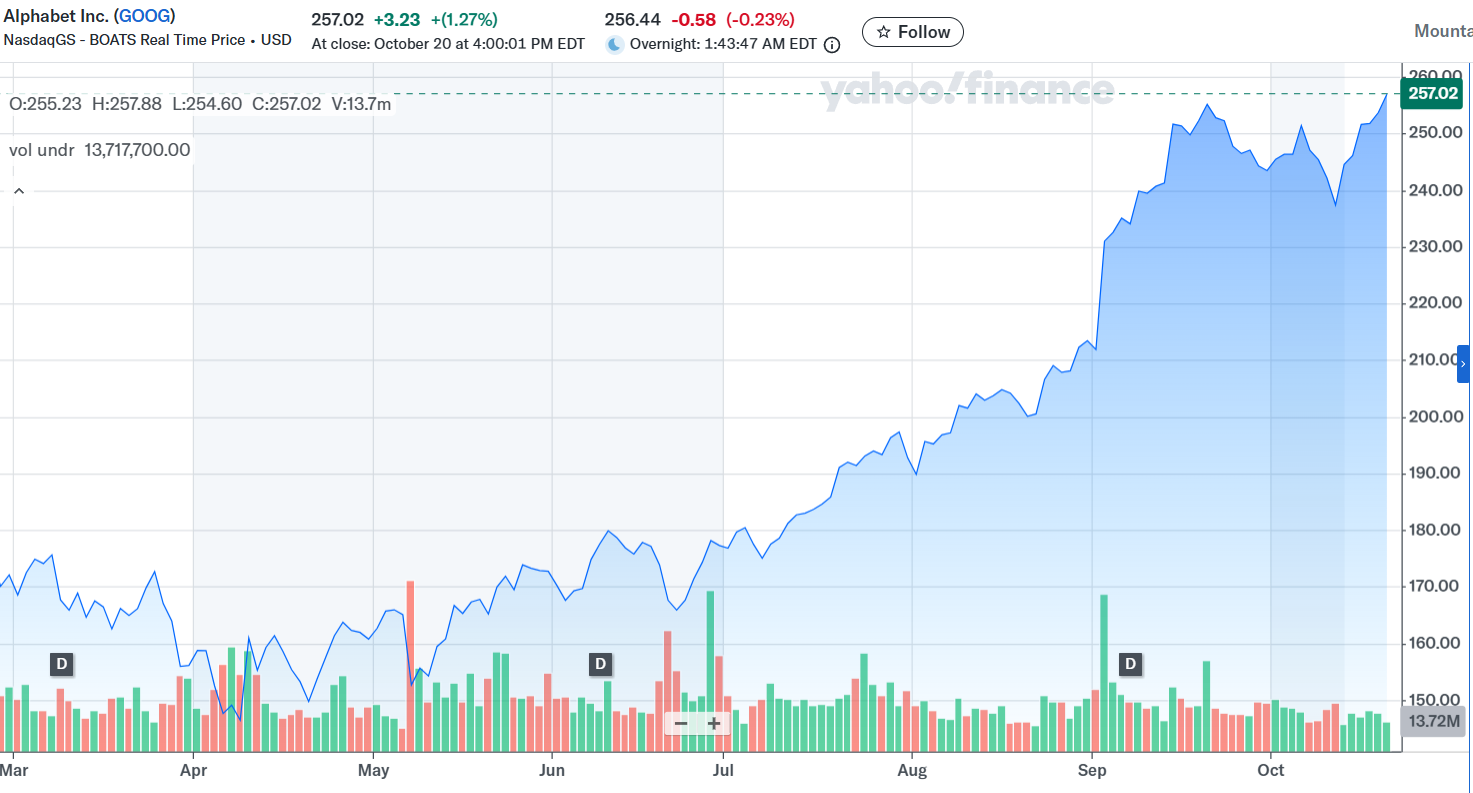
From $150 to $250 in six months. Of course, it sounds simple only in hindsight. But the example shows how it works: revisions in expectations happen when the market sees new evidence about the company’s performance and usually sales are the most convincing factor.
Step 2: Select the Turbo Trigger
You can figure out whether costs or investments qualify as the turbo trigger by determining how far they must vary from their PIE estimates to have a greater impact on shareholder value than does the sales trigger. Assume that you estimate the PIE for a stock that currently trades at $20. The high and low estimates of the sales growth rate, filtered through the expectations infrastructure, yield values of $30 and $10, respectively. Use the expectations infrastructure to calculate the high and low operating profit margins, solely as the result of cost efficiencies, required to create a comparable impact on shareholder value. Look at the result and consider the likelihood that the margin will be that variable.
Sounds a bit complicated, but actually it’s a simple step. We already have forecast prices for positive and negative scenarios. Now we need to just put them into the model, make the candidate trigger unknown (X), keep other values intact, and solve the equation to find which level of X leads to the given price. We need to do it four times: low and high prices for both costs and for investments.
After that, we can see whether such changes are likely (for example, if the positive scenario for or a consumer-staples company requires 40% reducing in costs, it fails the laugh test).
Step 3: Refine the High and Low Estimates of the Turbo Trigger and Calculate the Shareholder Values That Result
You should refine your initial estimates of turbo trigger variability before you decide to buy, sell, or hold. Specifically, drill down one more level to the leading indicators of value. Leading indicators are measurable, current accomplishments that significantly affect the turbo trigger and hence shareholder value. Examples include customer retention rates, time to market for new products, number of on-time new-store openings, quality improvements, and average cycle time from order date to shipping date. Two or three key leading indicators typically account for a substantial percentage of the variability in the turbo trigger.
Just common sense: do not trust the dry model as is. Cross-check its plausibility with additional data directly tied to business performance.
Important side notes
Up above I sketched a skeleton of the process of the expectations investing. Now I will add a couple of quotes that help strengthen the intuition. They show how different some things look through the lens of expectations investing.
Belief: Earnings per Share (EPS) Dictate Value
Reality: Earnings Tell Us Little About Value
(...)
The shortcomings of earnings include the following:
• Earnings exclude a charge for the cost of capital.
• Earnings exclude the incremental investments in working capital and fixed capital needed to support a company’s growth.
• Companies can compute earnings using alternative, equally acceptable accounting methods.
Not all revenue sources are created equal.
Let’s continue poking into Google’s statements to find an example. For Q1 2025 they reported EPS of $2.81 and noted that $0.62 (22%!) came from a gain on equity securities. That’s great, but Google is not a hedge fund. What matters for shareholders is how well Google earns money in its own business and how successfully it innovates to sustain and grow it.
Moreover, the report also states: “$8.0 billion unrealized gain on our non-marketable equity securities related to our investment in a private company”. You see now how messy EPS is? It brings together everything — including paper gains.
We’ve developed a golden rule of share buybacks that you can use as a universal yardstick for evaluating the economic attractiveness of buyback programs: A company should repurchase its shares only when its stock is trading below its expected value and no better investment opportunities are available.
Pretty straightforward. I caught myself thinking “buybacks are good, they usually drive prices up”. But buybacks are not a free lunch. Just like with dividends, spending money here means no investing there.
I can keep quoting — the book is really full of insights. But I think the best you can do at this point is switch to the book itself:
Buy Expectations Investing on Amazon (affiliate link).
Extra chapters that were not included in the final version of the book
This publication is for informational and educational purposes only. It is not investment advice, tax advice, or a recommendation to buy or sell any security. I am not a licensed financial advisor. Investing involves risks, including the possible loss of capital. Always do your own research or consult a professional before making financial decisions.
Excellent breakdown. Expectations Investing cuts right through the noise — it’s one of the few frameworks that actually forces investors to reverse-engineer what the market’s already assuming instead of guessing the future.
Most people forget that prices aren’t opinions — they’re equations. Every stock carries an implied growth rate baked in. The pros don’t forecast; they backsolve.
│ Reality Check: You don’t beat the market by knowing more — you beat it by knowing what it already expects and where it’s wrong.