
LLM vs. financial analyst, commodities vs. inflation, and two-factor funds vs. one
Insights from three recent research papers

From time to time I open the scientific publication aggregator papers.ssrn.com and search for useful new articles. Browsing it is as addictive as scrolling Twitter, but much more enlightening. Let's discuss the catch of today.
Outperformed by AI: Time to Replace Your Analyst?
https://papers.ssrn.com/sol3/papers.cfm?abstract_id=5222427
Method: different LLMs and human analysts wrote stock SWOT analyses, then an expert assessed them.
Results:
1. LLMs often match or exceed human analysts in output.
2. But LLMs sometimes “miss the forest for the trees” on more strategic or qualitative aspects. Human expertise remains essential for nuanced strategic insights.
It’s no surprise that AI can process financial data. But it was refreshing, for a change, to read not a hype piece, but research with a methodology. Of course, it would be much better if we had truly quantitative data—for example, the performance of LLM-generated portfolios over the long term with regime shifts. But at least here, we have a thorough framework for evaluating the SWOTs.
The author also states that "advanced prompts produce significantly better SWOTs than basic prompts". It is interesting to watch how the general attitude towards prompt complexity is changing. In 2022 "prompt engineer" was a sexy profession of the future. A couple of years later AI enthusiasts claimed that LLMs could understand user needs without sophisticated prompts. Now the importance of advanced prompts is apparent again.
The article was written before the release of ChatGPT 5. From personal experience, compared with ChatGPT 4, the new model requires more precise and detailed instructions to force deeper answers.
Small, Value, or Small/Value?
https://papers.ssrn.com/sol3/papers.cfm?abstract_id=5199124
Method: compare the performance of two types of portfolios: a) core broad market + 1 satellite fund of small and value stocks; b) core broad market + 2 satellite funds, one small and one value.
Results: the one-satellite strategy has higher return, slightly higher volatility, and somewhat higher risk-adjusted return than all the two-satellite strategies considered.
This fits intuition about factor exposure. By picking funds separately, we capture small-growth and large-value stocks. A cap-weighted core already tilts toward large caps (including large-value), so adding a separate value fund increases overlap.
The authors also noted that the one-satellite strategy would make the portfolio a bit simpler; it would be slightly easier and cheaper to rebalance.
Rethinking the 60/40 Portfolio: Dynamic Hedging with Commodities
https://papers.ssrn.com/sol3/papers.cfm?abstract_id=4909458
Method: compare the performance of three portfolios: a) standard 60% stocks and 40% bonds; b) 60% stocks, 30% bonds, and 10% GSCI (a commodities index); c) 60% stocks, with 40% dynamically allocated between bonds and GSCI.
Results: the dynamic allocation showed the best results; classic 60/40 came second; 60/30/10 had the worst returns, volatility, and Sharpe ratio.
The outperformance is modest—around 0.5%. I am not convinced that the strategy as it is would perform well enough in the real world. We need to account for execution costs and taxes.
The most interesting part is the indicator used for the allocation. Let's unpack the allocation rule that gave a pulse to the worst-performing 3-asset portfolio:
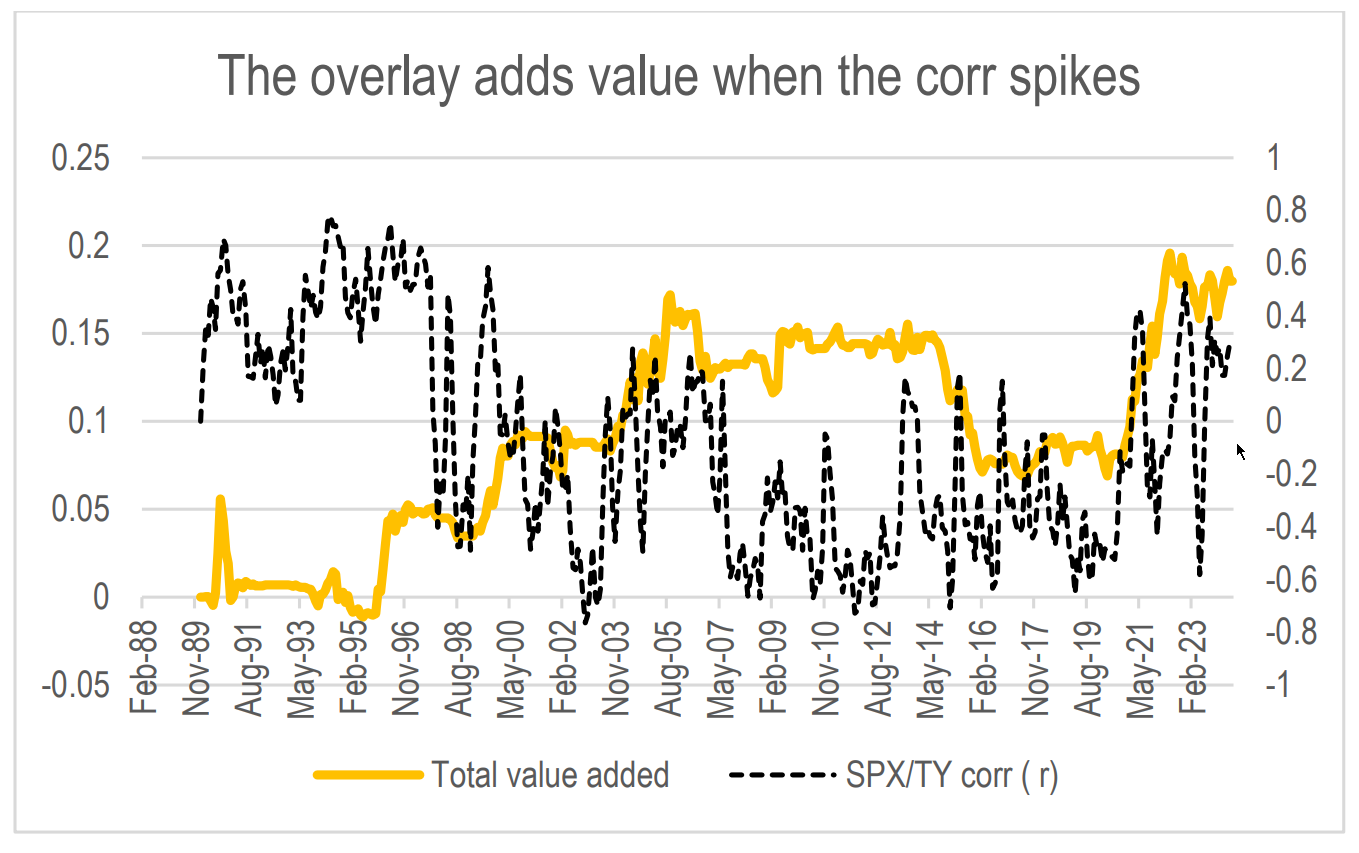
When the current stock-bond correlation exceeds the correlation observed over the previous six months, we allocate 2% of the portfolio from bonds to the GSCI index at the end of each month. This process continues until the allocation to the GSCI index reaches a maximum of 20%. Conversely, when the correlation over the preceding six months begins to decrease, we incrementally reallocate the weight back to bonds.
The stock-bond correlation looks like a good candidate for detecting regimes. The authors show that the dynamic portfolio gains value when the correlation spikes:
So, this indicator:
worked well in this backtest;
very simple to calculate;
rooted in metrics directly connected to assets already present in real portfolios.
Using stock-bond correlation leaves room for another indicator without overcomplicating the model. Adding other metrics, for example, for selecting commodities, could give the strategy a more distinct edge. Of course, it’s an untested idea; I might explore it properly in the future.
That’s the latest catch from the research nets—let’s see what the next haul brings. Stay tuned!
This publication is for informational and educational purposes only. It is not investment advice, tax advice, or a recommendation to buy or sell any security. I am not a licensed financial advisor. Investing involves risks, including the possible loss of capital. Always do your own research or consult a professional before making financial decisions.