
Seasonality in gold: do some months outperform the rest?
An analysis of returns over the past 25 years

This year gold rose by almost 50%, making it hard to ignore.
I decided to really dig into the mechanics behind gold prices. This is the first post about my ongoing research.
I started with a simple matter: seasonal trends. However, in the first 5 minutes of googling, I realized that it’s not that simple. For example, a reputable study says September is the strongest month. Another claims September is the worst. Okay, it seems I need to skip reading and start gathering data.
Gold futures monthly performance (2000–2025)
I downloaded prices for GC=F from Yahoo Finance from 31 Aug 2000 to 30 Sep 2025 and calculated monthly returns.
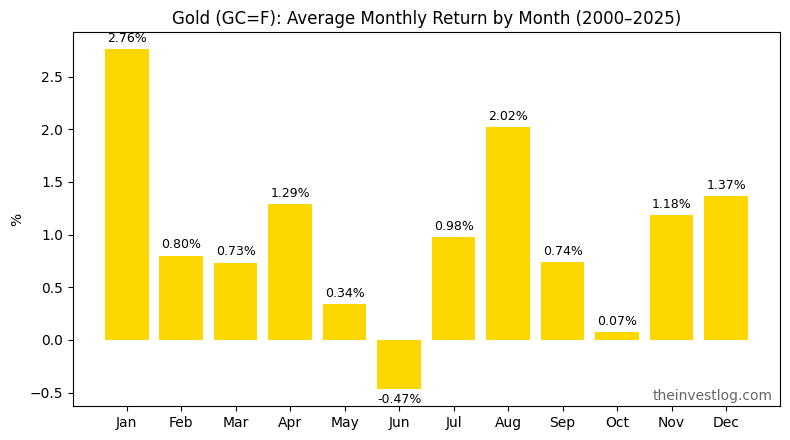
Controversial September looks just boringly average. January and August seem to be the strongest, and the only dent is in June. Let’s see whether the picture changes if we switch to median returns.
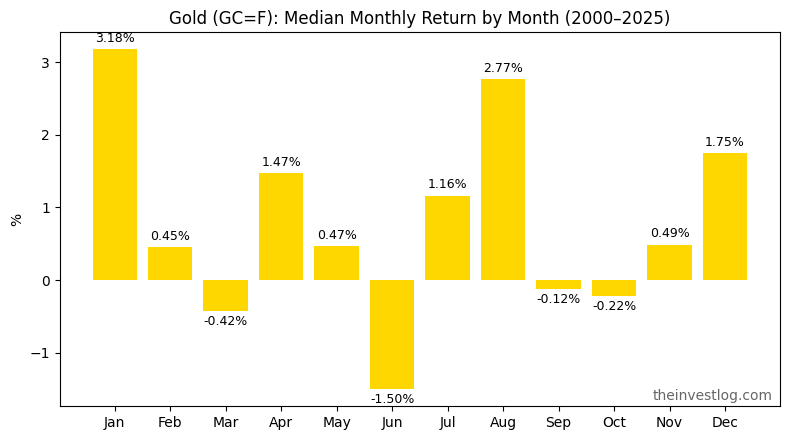
That’s interesting. September went from mildly positive to negative; January, August, and June show the same behavior as with average returns, but more pronounced.
Let’s look at how often each month yields positive returns.
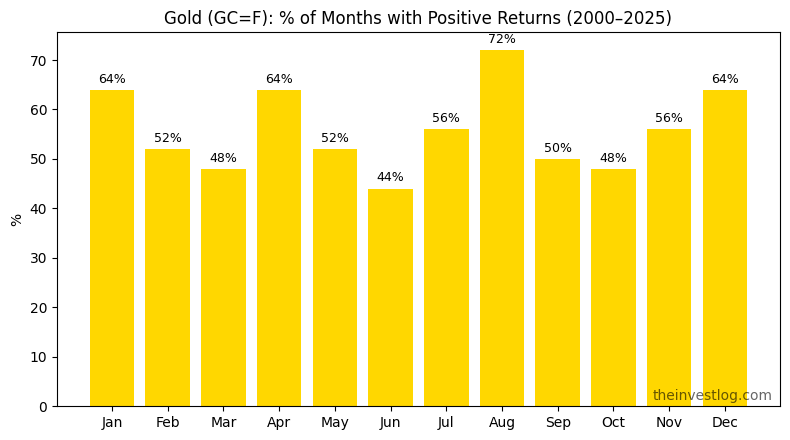
Again, June is the worst; August and January are strong; April and December are on the same level; September is neither here nor there.
Now we’ve got the general picture of how gold behaved over the last 25 years. Time to ask the killer question:
Are these results statistically significant or just noise?
25 observations per month are a modest sample, prone to noise. But taking more years makes the results less relevant: the world is changing quickly, and so is asset seasonality. We need both statistical significance and relevance.
That is why I used the bootstrapping technique:
Shuffle all monthly returns randomly among months to create an “alternative history.”
Repeat this 50,000 times.
For each shuffle, measure the difference between the chosen month and all other months.
Count how often the shuffled difference is as large (or larger) than the real one.
That fraction is the p-value — the probability the observed edge is just random noise.
If p < 5%, the effect is usually considered statistically significant.
If it’s closer to 20% or higher, it’s almost certainly just noise.
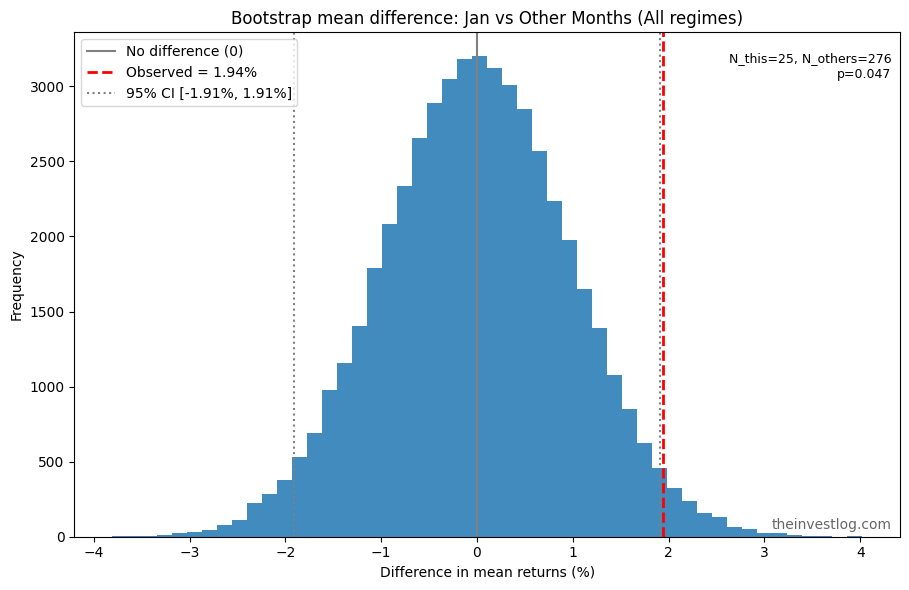
It is quite a standard approach, so there are ready-made Python functions for this. As I expected, most of the results did not survive the test. Here are the two most significant:
January p-value: 4.7%
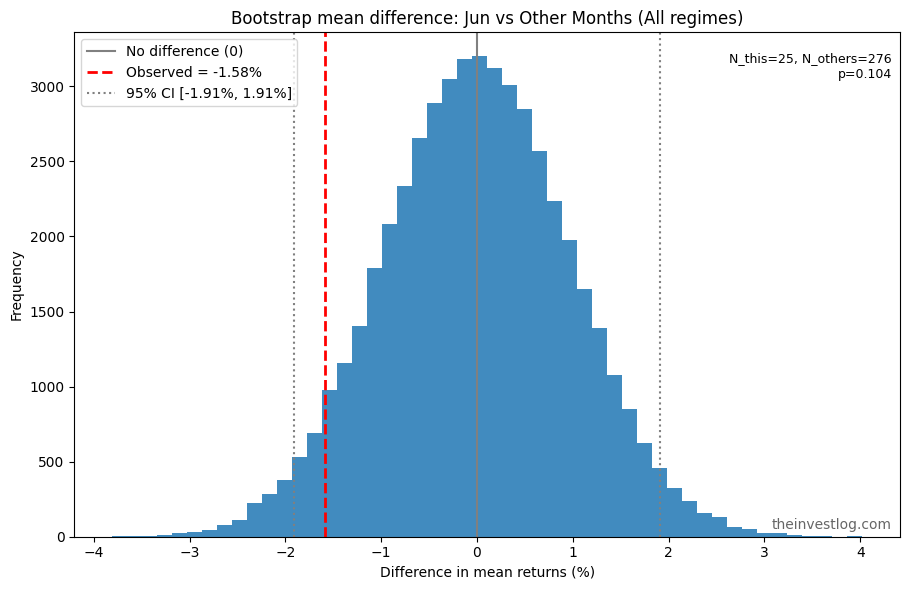
June p-value: 10.4%
In plain words, January’s superiority seems quite real:
June’s weakness is much less certain, but also probable:
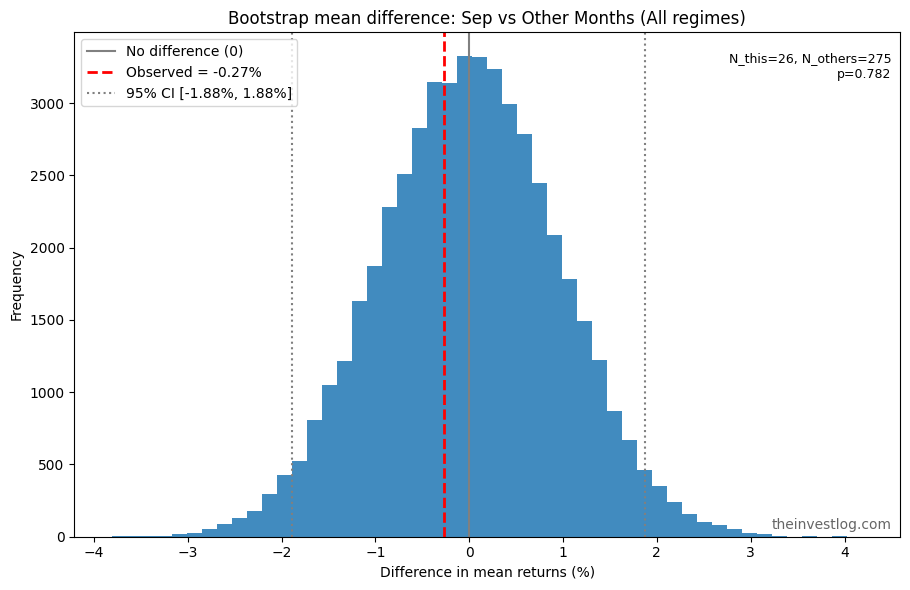
Infamous September shows one of the highest p-values — 78.2%, meaning that there is no point in looking at any trends here (at least without additional conditions like regime splits). September sits comfortably in the middle of the distributions, looking like a typical month in the random simulations:
A note for statistics nerds: these are exploratory, unadjusted p-values from a small sample; treat them as suggestive, not definitive.
Sanity check: performance of SPDR Gold Shares ETF (GLD)
To check the results, I decided to repeat the analysis using another gold-related product.
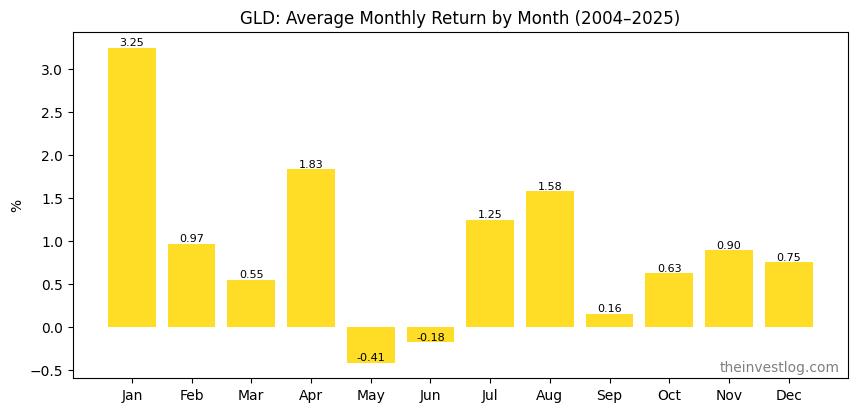
The picture is quite similar: strong January, weak May and June. This increases the credibility of the initial findings.
GLD has a shorter history (Yahoo Finance has data since the end of 2004), so I expected less-pronounced statistical significance. I was half-right:
June’s result lost even a hint of statistical rigor, with a p-value of 0.26 (a 26% probability that the relative weakness is just bad luck).
But January reinforced its edge, with a p-value of 0.02 (in only 2% simulations I got the same or better results).
I would be glad if someone verified my results. Feel free to use these files with prices and returns:
Conclusions
The overall patterns are similar across gold futures and the gold ETF.
All the months except January and June have results that are too inconsistent; there is no reliable pattern.
June’s results have some significance. Is it enough to influence investment decisions? Everybody should decide for themselves. For me, it is enough to make a mental note not to buy gold in May and June, but not enough to try shorting gold in these months.
January tends to outperform other months. That doesn’t mean we can win every time by buying gold in December and selling it in February. Note that 34% of all Januarys have negative results. Still, a bullish bias in January exists. Again, for me personally, it is sufficient reason to try to exploit this tendency.
This publication is for informational and educational purposes only. It is not investment advice, tax advice, or a recommendation to buy or sell any security. I am not a licensed financial advisor. Investing involves risks, including the possible loss of capital. Always do your own research or consult a professional before making financial decisions.