
Which ETFs survived the three recent stock market declines
Case study

This week I found myself staring at my investment plan, written this spring.
Today's market is scary. Valuations are climbing to the level of the dot-com crash. Even optimists like Sam Altman admit we’re in an AI bubble.
So just buying more stock ETFs (even with a value tilt) doesn't look like a smart plan for developing my portfolio. I need to consider redirecting new buys toward safer assets. But what are the safer assets?
I decided to take a closer look not at the textbook definitions, but at data relevant here and now.
Study design & dataset
I wanted to find assets that remained stable across the last 3 market downfalls. At least partly, the recent corrections were also induced by fears of overvaluation, so they might reflect how the market would behave in a bigger crash.
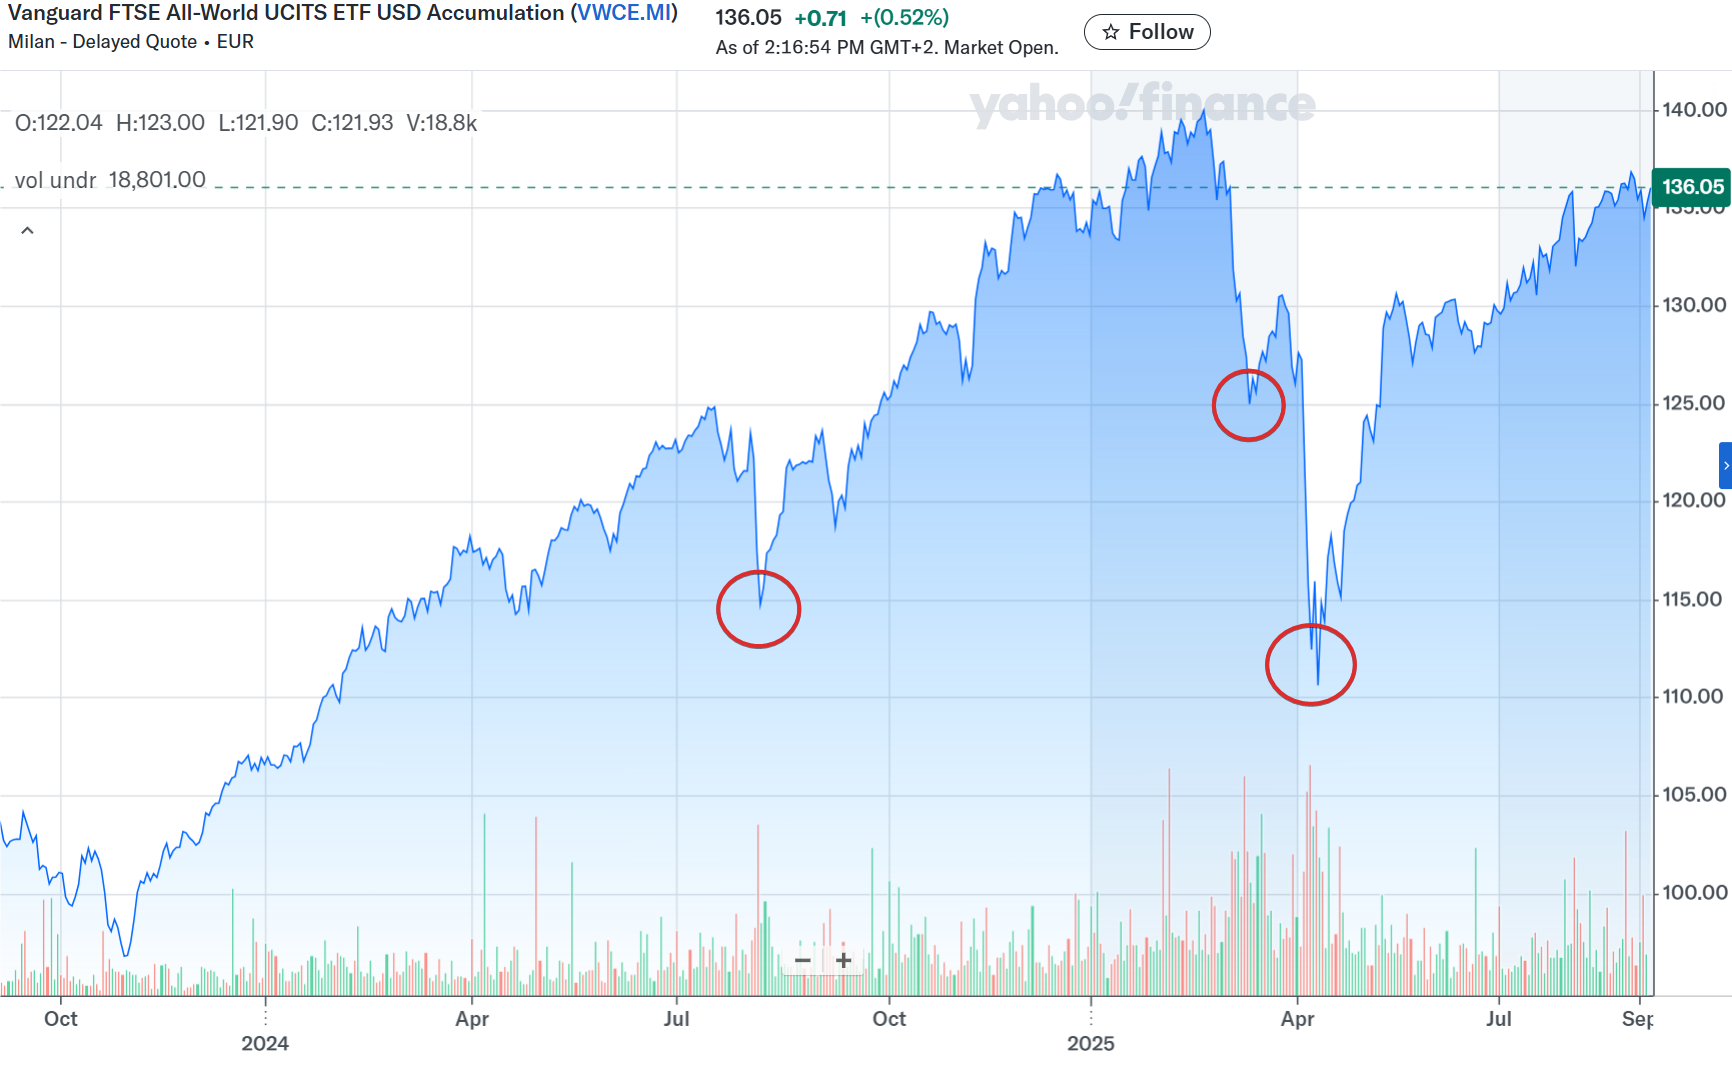
I invest in EUR, so I picked Euronext as the biggest EU stock exchange. Vanguard FTSE All-World UCITS ETF (VWCE) serves as a proxy for the world stock market.
Using a Python script with Yahoo Finance data, I searched for the 3 worst 10-day periods of VWCE performance over the last 2 years. Initially, I wanted to go with a 1-year period, but there were only two significant declines over a 10-day window. I didn't want to reduce the window because I wanted to find relatively long corrections, not random bearish jolts.
I ended up with the following periods:
2024-07-23 → 2024-08-06: Weak earnings
2025-02-27 → 2025-03-13: U.S. tariff threats; earnings also weak
2025-03-26 → 2025-04-02: Tariff anticipation and announcement
The overall period turned out to be just a couple of months wider than 1 year.
At least partly those declines were indeed caused by fears of overpricing — that is exactly the reason why today's market makes me nervous.
I parsed historical data about 1725 ETFs and ETPs trading on Euronext Milan to assess how they behaved during those 3 periods.
Then I cleaned the list a bit, deleting tickers without full data (mostly these were recently added ETFs). I ended up with 1603 ETFs and ETPs. By any standard, it is a diverse set of investment strategies.
It became immediately obvious that the set of strategies was diverse indeed. Maybe too much for my taste. Here are the Top 5 winners during the April crash and their strategies:
WisdomTree S&P 500 Vix Short Term Ftr ETN USD — Leveraged index short
Leverage Shares -3X Short Coinbase Coin ETP USD — Leveraged single equity short
WisdomTree Copper 3X Daily Short — Leveraged commodity short
WisdomTree Brent Crude Oil 3X Daily Shrt EUR ETF — Leveraged commodity short
WisdomTree Euro Stoxx 50 3X Daily Sh Etfort EUR ETF — Leveraged index short
Their performance during the 10 days was up to 243%. Yeah, I found the assets that are great for precise market timing. Okay, I will save the list for the next life; maybe in my next reincarnation it will work.
If I want to find something more actionable, I clearly need to weed out the leveraged shorts and other super risky strategies. I ran the script again, but this time I also got the 1-year performance.
This time I was not sorting by returns, but filtering by those two criteria:
The maximum decrease across all 3 events is 1% (to keep cash-like stability).
The minimum 1-year performance is better than 3.25% (current estimation of EU 10-year Eurozone government bond yield — a proxy for risk-free rate).
Here is the file with the dataset and the results of the filtering:
Findings
There are 41 assets that match both criteria for all three events.
The overwhelming majority are ETFs based on bonds of all sorts: government, corporate, inflation-protected.
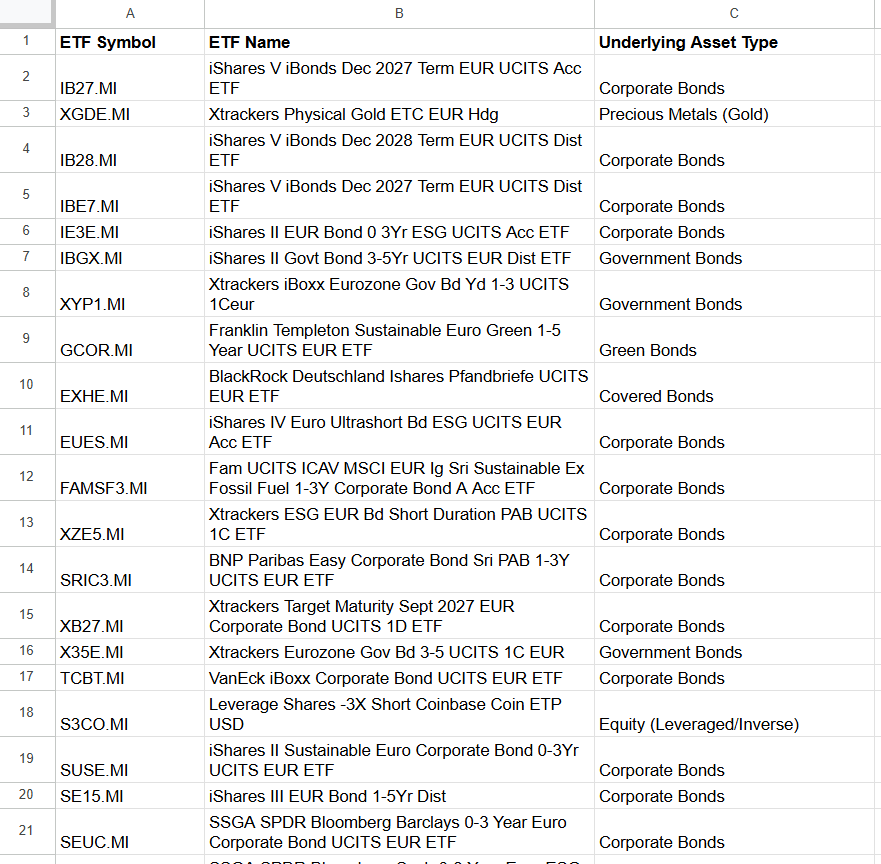
It is both normal (bonds are the classic hedge against growth uncertainty) and somewhat surprising. I expected to see at least a few commodity-based products and maybe even low-volatility equity or mixed ETFs. In reality there are only two "survivors" outside the bond universe:
S3CO Leverage Shares -3X Short Coinbase Coin ETP USD
XGDE Xtrackers Physical Gold ETC EUR Hdg
S3CO is a specimen of the very high-risk leveraged products I weeded out by comparing 1-year performance with the risk-free rate. Well, it would be a lucky pick back then, but I doubt we can rely on its performance in the future.
XGDE is more interesting. There are plenty of other ETCs on the market, but only this one satisfied both criteria. I think the reason is EUR hedging. For example GOLD (Amundi Physical Gold ETC USD) was down by 1.5% during the first event (2024‑07‑23 — 2024-08-06).
The extra stability didn’t come for free. TER (total expense ratio) is 0.28% for XGDE and only 0.12% for GOLD.
Conclusions:
Fixed-income products showed the best steadiness. That doesn't make them a universal hedge, of course. The findings show that they hold during these 3 events, no more, no less. In recent history there have been enough examples of strong correlation between stocks and bonds.
Commodities also have defensive potential, but they are much more nuanced. It’s worth noting that among the winners were shorted commodities, such as oil and copper. This means oil and copper prices plunged in unison with stocks.
In the next article I am going to continue the analysis and use the same data, but with a bit more complex metric of performance, not just a strict 1% threshold. Stay tuned!
UPD: Here is the next article I promised:
Balancing return and stability over the recent market crushes

In the previous post I studied which ETFs held up during sharp market declines. I wanted to capture the most recent trends and picked a short period (a bit more than a year), which gave me only 3 significant crashes.
This publication is for informational and educational purposes only. It is not investment advice, tax advice, or a recommendation to buy or sell any security. I am not a licensed financial advisor. Investing involves risks, including the possible loss of capital. Always do your own research or consult a professional before making financial decisions.