
An update on Lululemon Athletica ($LULU) after the Q1 2026 report and new guidance
A reverse-DCF read: the market is extrapolating one soft year into ten.

In May I initiated a LULU position at $125. Last week the company submitted a 10-Q report and issued guidance for 2026. The stock immediately dropped 10% and partially recovered in the following days; now it trades around $117. Many analysts downgraded their price targets.
Weak numbers aren’t a surprise:
There is no strong indicator that margins are holding. Judging by Google Trends, February and March were quite soft. If the next quarterly report shows EPS miss and weak margins, the price can easily drop below $100. If it happens, I intend to add to my position, provided the fundamentals still imply today’s long-term picture.
(a quote from my previous post). What’s interesting is that the company provided guidance on the earnings call.
An updated reverse-DCF model
Let’s see what the combination of the guidance, Q1 numbers and the current LULU 0.00%↑ price implies1. One of the scenarios that reconciles the price and cash flow path is:
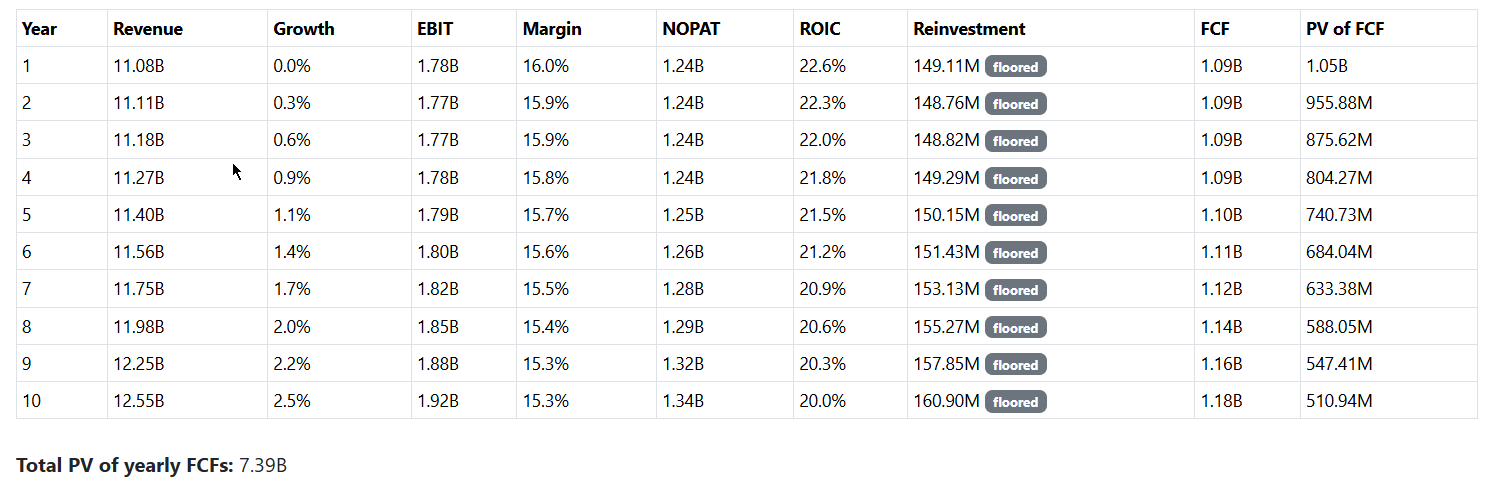
The model reflects two quite pessimistic assumptions.
1. Capex doesn’t deliver
We have simultaneously:
Flat revenue (shrinking in real terms, then keeping up with terminal growth rate).
Steady reinvestment (around $150M growth CAPEX a year).
What does this mean given Lululemon’s strategy? The company manically keeps opening new stores, but they do not increase sales at all. That’s possible (everything is possible), but I don’t think it is likely. The new stores are being opened mostly in high-growth regions (China, Mexico, rest of the world), not in saturated US and Canada2.
2. Margin fades to 15.3%
There are two viewpoints on Lululemon’s desirability, brand power, and consequently, margins:
The brand “lost its cool” and the margin compression is permanent.
The brand is still strong, margin compression is induced by tariffs and staleness of the inventory; it is temporary.
I think the reality is close to the second view.
Evidence #1: inventory.
Compared to Q1 2025, inventory is growing more slowly than sales: revenue up ~4%, inventory up only ~2%.
“On a unit basis, inventory decreased approximately 4%. The difference between dollar inventory growth and unit inventory growth relates predominantly to higher tariff rates relative to last year and foreign exchange.” (from the earnings call).
Evidence #2: full price sales vs markdowns (sales with discount).
Three quotes from the earnings call:
In the Q1, we saw a high single-digit increase in reg price globally. We did see a meaningful sequential improvement in the U.S.
We're having a bigger impact in spring summer clearance in Q2 with an expectation of markdowns up 50 basis points, and then some recovery as we move into the second half.
We expect markdowns for the full year to be flat to slightly improved.
That doesn’t look like a permanent brand destruction. A flat-to-positive trend in both areas signals the health of the commercial engine and its pricing power.
Returning to the whole model: I think it is an overly pessimistic scenario. Even moderate growth or margin improvement in the coming years could reset expectations and push the price higher3.
Tariffs as a potential source of optimism
When looking at tariffs for the full year, our guidance now assumes an incremental rate of 10% for Q2.
This is down from our prior assumption of approximately 20%. For the back half of 2026, we continue to assume a 20% incremental rate. While we are participating in the refund process, our guidance assumes no recovery of tariffs paid under IEPA.
So, there are two tariff-related catalysts that could improve guidance:
a successful refund process;
tariffs holding at 10% during Q3 and Q4.
What can break the thesis
Now for the most important part. It is always easy to find positive signs about a stock you hold, no matter the circumstances. So it is important to document what changes should force you to reconsider in advance. For me, these flags are:
Inventory accumulates faster than sales grow.
Markdown persistence in Q3 and Q4.
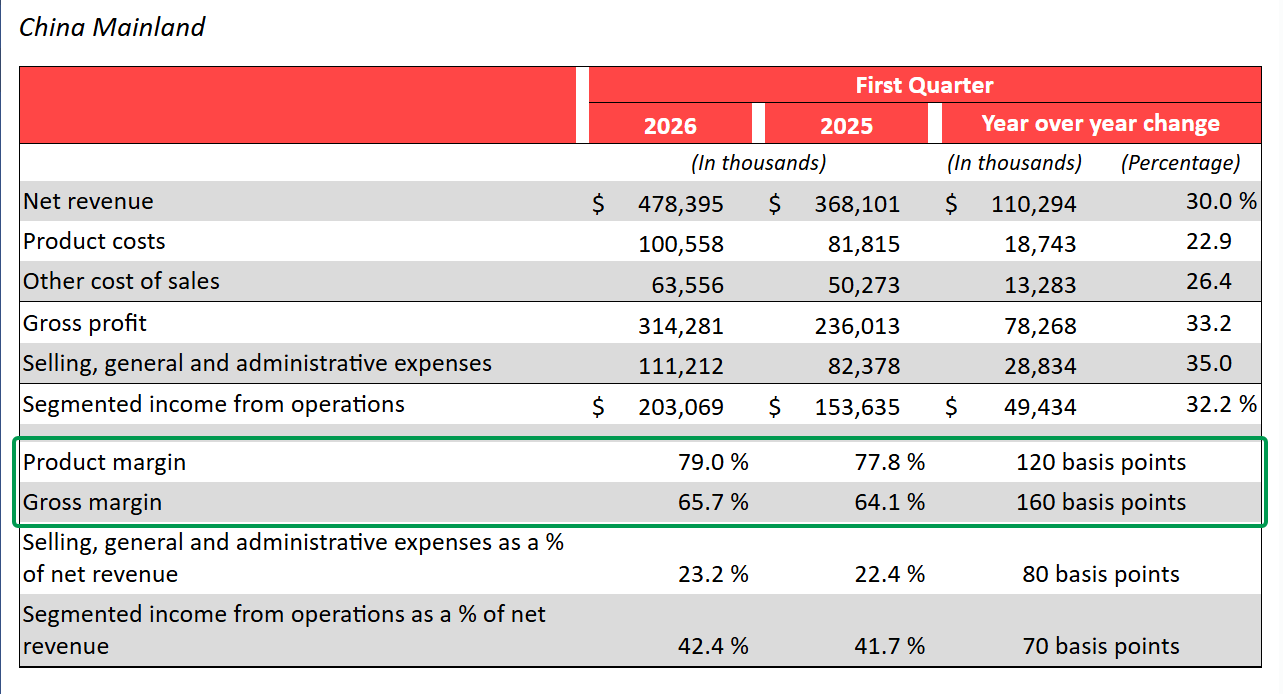
China slowing down.
Another guidance cut.
Reduced buyback program.
Conclusion
The $117 price implies continuing deterioration beyond the guidance. The thesis holds (though the risks also persist). The new price is only slightly lower than my entry point, so I didn’t add.
UPDATE: I added on the following dip around $111 (I use EU broker, exact price is €97.5). My average buy in is €102.69, it is roughly $117.
This publication is for informational and educational purposes only. It is not investment advice, tax advice, or a recommendation to buy or sell any security. I am not a licensed financial advisor. Investing involves risks, including the possible loss of capital. Always do your own research or consult a professional before making financial decisions.
Here are the basic inputs for the model I used:
Share price: $117 (around the June 8, 2026 close).
Diluted shares: 113,665,387 (Full calculations here: https://tools.theinvestlog.com/calculators/adjusted-shares/#LULU; note that the previous version of the calculator had a bug: it didn’t count exchangeable shares, so the number in the previous article was lower than it should have been).
Total debt: Current lease liabilities 357,204 + Non-current lease liabilities 1,778,804 = 2136008 (10Q, in thousands). I did not add back imputed interest on the lease liability to EBIT to keep the calculations simple. With EBIT around $1.7B adding $2B*0.03 pre-tax doesn’t move the needle much; more importantly, bigger EBIT makes the market-implied scenario even more pessimistic, so cutting corners here doesn’t hurt the thesis.
Prior annual revenue: 11,102,600 (10K, in thousands).
Current annual revenue: 11,075,000 (midpoint of guided revenue: “We now expect revenue to be in the range of $11 billion-$11.15 billion, flat to down 1% relative to 2025”).
Tax rate: 30% (guided: “For the full year 2026, we expect our effective tax rate to be approximately 30% versus our 2025 effective tax rate of 29.5%.”).
Total shareholders’ equity: 4,825,601 (10-Q, in thousands).
Worth noting that in China not only sales are growing; margins are improving as well:
As a reminder, this is a reverse-DCF scenario in expectations investing framework, not a forecast. The inputs like target ROIC, terminal growth rate, WACC and so on are modelling choice. You can create another reconciliation scenario with better growth or lower reinvestment; it will bring the margin even lower, so the pessimism is still here.