
Emerging markets ETFs: outperformance starts with a tilt
A study of EM ETF strategies across 7 market regimes

Recently I shared some statistics demonstrating that European dividend ETFs outperformed broad market European ETFs in the last 5 years. This was a bit unexpected, so I decided to take a look at emerging markets: what if there are promising strategies there too?
I took 78 tickers1 and compared:
Total inflation-adjusted returns, assuming dividends are reinvested and accounting for taxes (20% by default) and transaction costs (0.2% by default).
Risk metrics: max drawdown, drawdown duration, Sortino ratio, and Calmar ratio2.
Rolling returns with 252- and 756-trading-day windows to neutralize the importance of the starting point in the time period.
I am focusing on the timeframe 2019-07-01 to 2026-04-013, which leaves me with 32 USD-, 11 EUR-, and 5 GBP-denominated ETFs
You can see and tweak the comprehensive results on this page (warning: a lot of numbers).
Performance of different strategies
Buy and hold is precarious: timing is critical, safe quiet compounding is questionable. Only 2 of 32 USD tickers have more than 50% of 3-year rolling returns positive after adjusting for inflation. Only five tickers have a best 3-year rolling total return higher than their best 1-year return4.
Broad cap-weighted indexes performed relatively poorly. Among USD funds, ranked by CAGR, only the 9th spot is claimed by a standard “buy the market” strategy. Moreover, this ETF has negative average 3-year rolling returns.
Dividend strategies also don’t outperform. Ranked by CAGR, they generally sit in the middle or even in the end of the list. Setting the tax rate to 0 doesn’t help much. On the other hand, if we consider a shorter period (starting 2021-11-30 to cover the last three market regimes, starting with inflation shock), all the dividend ETFs climb the list.
Strategies that exclude or underweight China worked relatively well. That’s no surprise given the weak performance of China equities from 2008 to 2025.
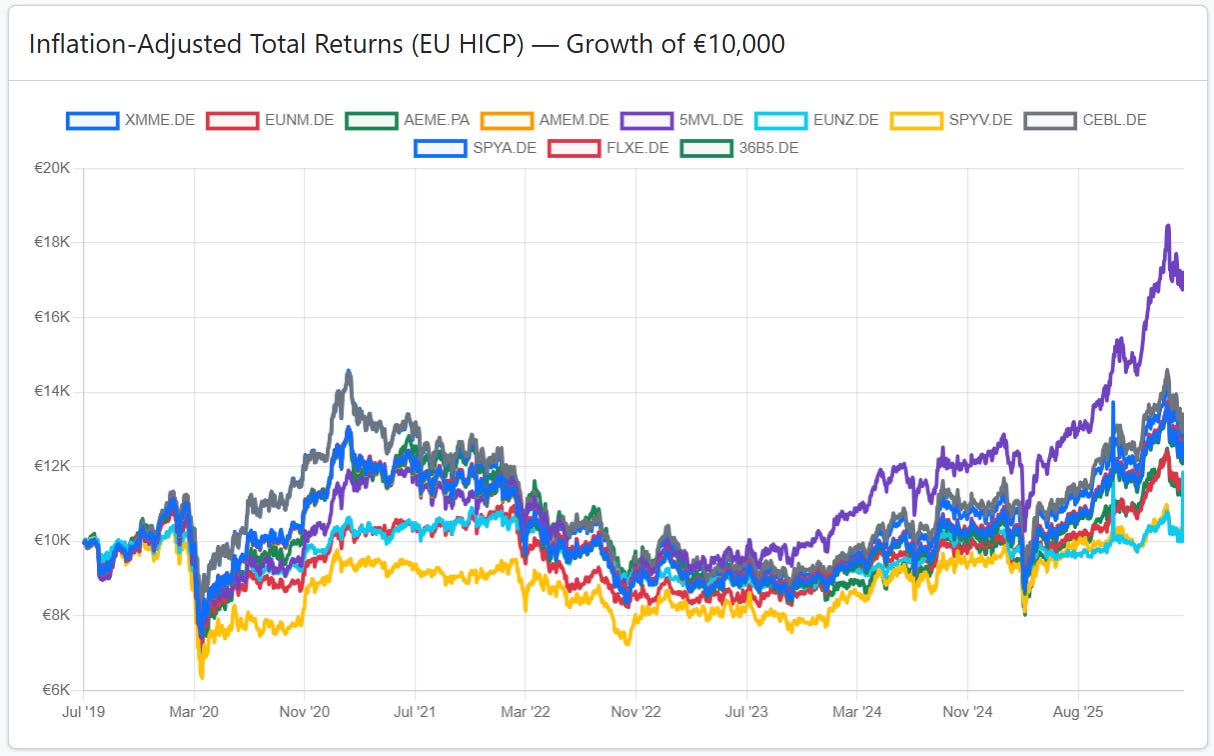
Value strategies also demonstrate stronger than average performance. For example, iShares Edge MSCI EM Value Factor (5MVL) clearly dominates the EUR-nominated selection for this period with 8.19% inflation-adjusted CAGR:

If we use a 1-year period to find more EUR tickers with data, two of the top four funds with more than a 30% return are ex-China and two are value-oriented. Among top 10 USD tickers there are several with a value tilt5.
Notable funds
Not a buy recommendation, just the ETF that caught my eye during the research.
Freedom 100 Emerging Markets ETF (FRDM)
This fund has the highest CAGR (9.16%, adjusted for inflation) among the USD tickers; most of the other metrics are also notably better than average. For example, it has the lowest drawdown duration (213 days, while half of the tickers have more than 1000 days).
The ETF has a unique methodology. It uses weighting based on personal and economic freedom metrics via quantitative composite country scores (a combination of 87 personal and economic freedom variables). This approach resulted to underweighting China and India in comparison with the cap-weighted EM indexes. We already know that ex-China ETFs performed better. But is this a structural advantage or just bad timing for Chinese equities?
Let’s run the comparison of these ETFs again on the timeframe when Chinese equities actually performed well. From 1 Jan 2025 to 1 March 2026 Shanghai composite index is up 27%, which is impressive. But over the same period FRDM delivered 96% return, other ex-China funds occupy the second and the third places by CAGR.
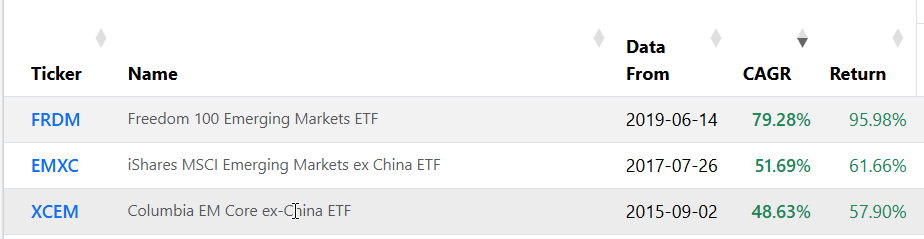
So even when China grows quickly, other EM demonstrated even quicker growth.
State Street SPDR S&P Emerging Markets Dividend ETF (EDIV)
The highest % of positive 3-year rolling return windows (81%, while the second-best Freedom 100 Emerging Markets ETF, has 53%).
7.35% CAGR since December 2021 (i.e. during the three most recent market regimes). Only FRDM has higher returns; but EDIV is superior in terms of average and median 3-year rolling returns.
EDIV is based on Emerging Markets Dividend Opportunities Index, so it is not just a high-yield ETF (more info below).
Cambria Emerging Shareholder Yield ETF (EYLD)
Top-3 by CAGR among USD tickers. Focuses on return to shareholders via dividends, buybacks, and debt reduction. This fund also has a value tilt, screening the investable universe by price to cash flow, price to book and enterprise value to EBITDA.
Why dividend strategies perform so differently?
As I mentioned, dividend funds have had mixed results. There are dividend ETFs among both good and bad performers. Let’s dig a bit deeper and find out why.
Take a look at the comparison of the two underlying indexes:
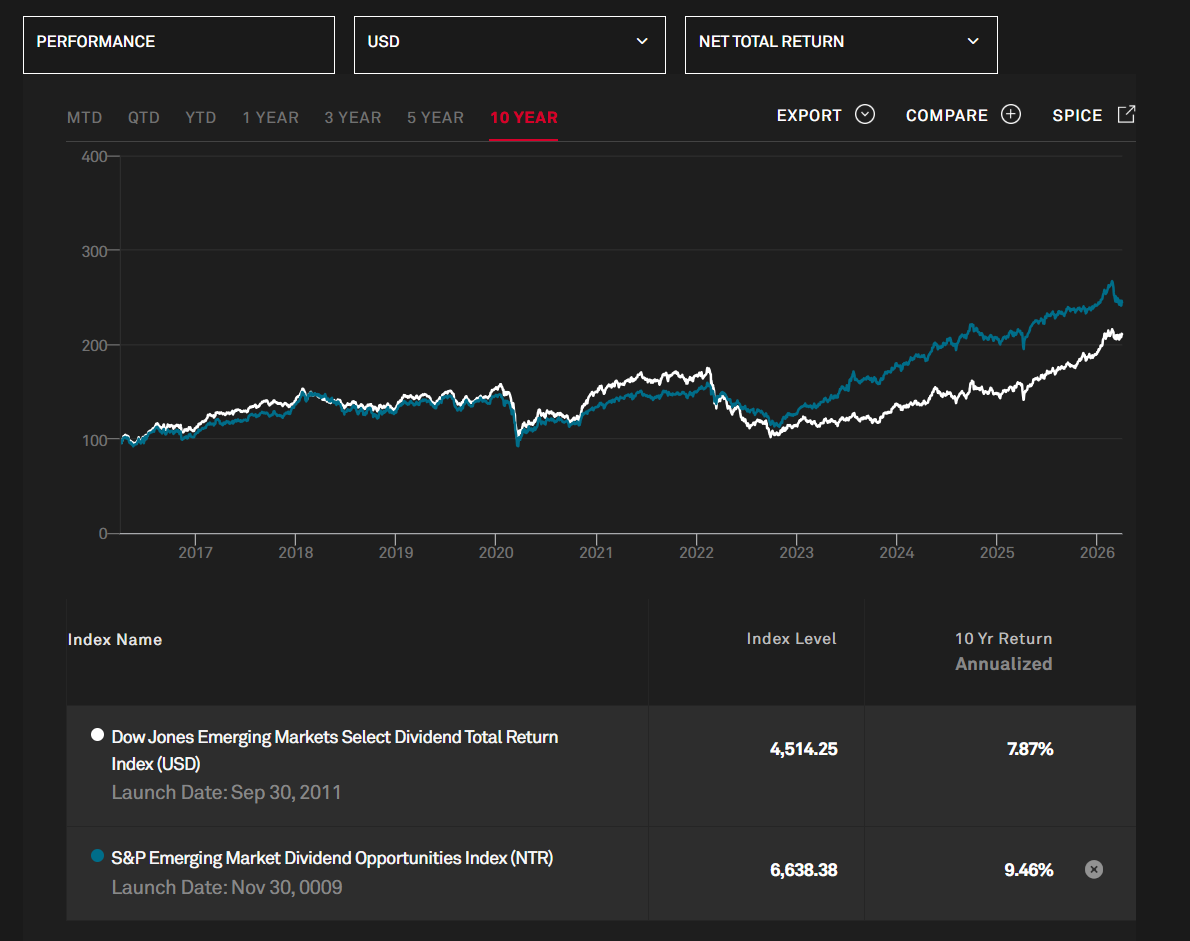
While both of them have “dividend” in the name, their methodologies are different. Select Dividend focuses on the yield itself. Dividend Opportunities applies much more sophisticated screens, for example:
Dividend Payout Ratio. The ratio of a stock’s Dividend-Per-Share (DPS) to its Earnings-Per-Share (EPS) must be less than 100%.
Earnings Growth. Stocks must have a positive, three-year earnings growth.
Momentum. Stocks that rank in the bottom 10% by momentum scores among all constituents are removed.
In the cheap money era this complexity might seem redundant. Select Dividends performed on par or even better than Dividend Opportunities in the first half of the chart and around 2021. But in the recent years Dividend Opportunities delivered much stronger results.
It’s just impossible not to quote Buffet here: “You don’t find out who’s been swimming naked until the tide goes out”, indeed.
Conclusions
Let’s quickly summarize the key findings:
A long-term uptrend isn’t guarantied; just holding EM in the portfolio without rebalancing might lead to long underperformance.
Value/quality strategies outperformed broad market.
High yield might be a sign of disciplined business and a component of a screening for the quality strategy. But high yield alone is often a dividend trap.
Routine reminder: it’s all about past results. The future might be different.
This publication is for informational and educational purposes only. It is not investment advice, tax advice, or a recommendation to buy or sell any security. I am not a licensed financial advisor. Investing involves risks, including the possible loss of capital. Always do your own research or consult a professional before making financial decisions.
“Emerging markets” is a broad and vague category. Different methodologies include different countries. I didn’t pay much attention to this at the start, because I wanted maximum diversity in my selection of strategies.
The Sortino ratio measures an investment’s return relative to its downside volatility; the Calmar ratio is CAGR/max drawdown. I do not use the common Sharpe ratio, because in practice volatility in positive territory can’t be a good proxy for risk.
Finding the right timeframe is always tricky. I wanted as many ETFs with data as possible, which rules out really long time periods, since many ETFs were created in the late 2010s or early 2020s. But I also wanted to reliably cover different regimes, so studying the last couple of years is pointless. I decided to start six months before COVID, which seemed like a reasonable compromise. But in some cases I also use both longer (test the findings’ durability) and shorter (to check the performance in a specific regime) periods.
The longer the investment horizon, the better a confident compounder should perform. For example, over the same period VOO had: +39.73% 1-year, and +78.63% 3-year best possible inflation-adjusted return.
iShares Emerging Markets Equity Factor ETF, Schwab Fundamental Emerging Markets Equity ETF, VictoryShares Emerging Markets Value Momentum ETF.