
Mercado Libre reverse DCF: pricing a strong but fragile fintech edge
Let's talk numbers, not vibes

I looked at MELI 0.00%↑ before earnings, ran a quick valuation check, and decided to pass. At 1850, the price required flawless execution. But after the dip the setup became more attractive, so I did a full analysis through an expectations investing lens.
Why MELI's valuation is so tricky
Mercado Libre is a hybrid: ecommerce plus fintech. It is a synergistic ecosystem, which is awesome for business, but a nightmare for analysis.
One of the most interesting and rarely discussed parts of MELI’s financials is float: money that Mercado Libre does not own, but holds temporarily. The two main sources are user balances and the lag between processing a payment and transferring it to a merchant.
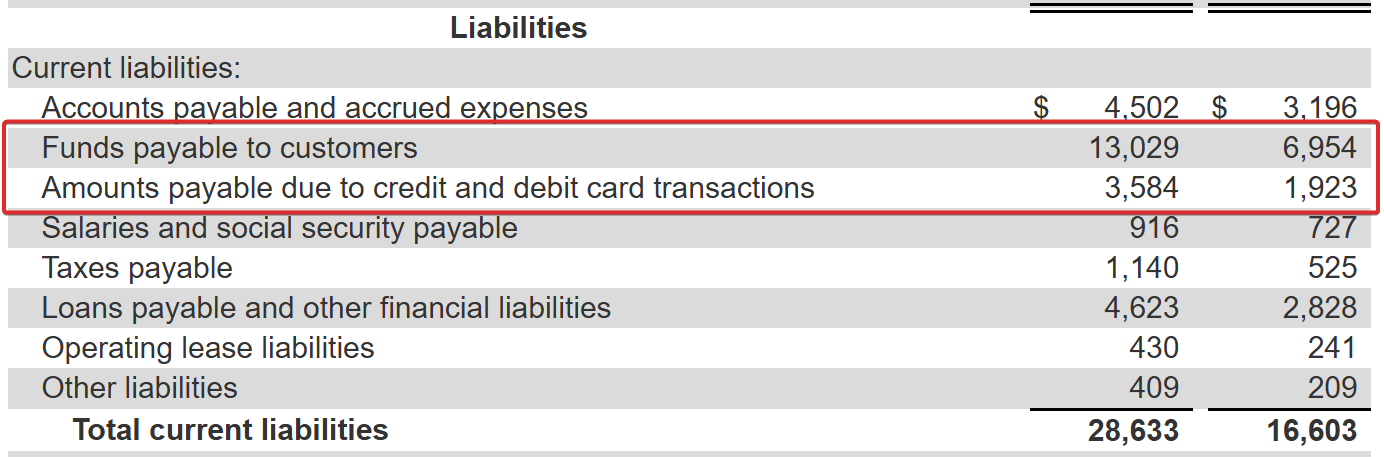
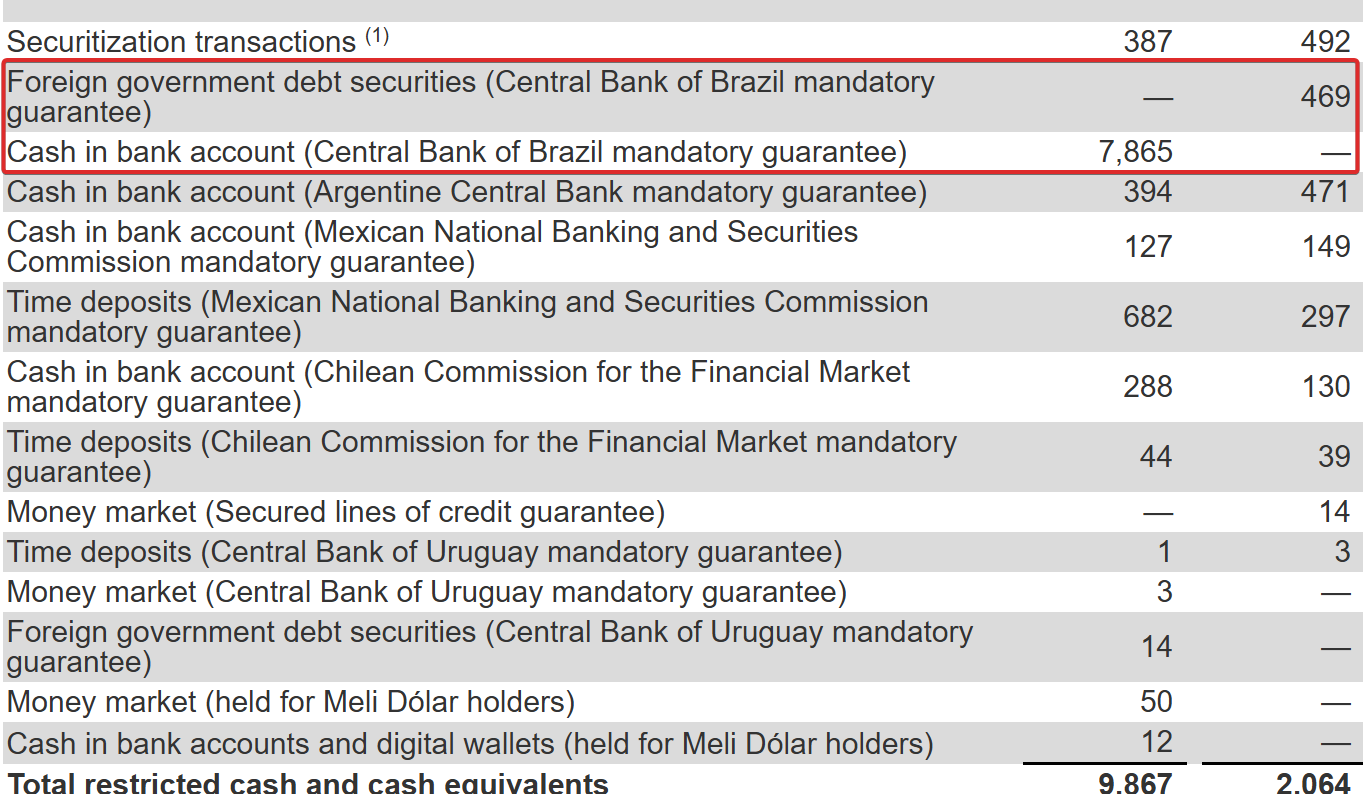
This money is an important source of liquidity, helping MELI to finance its aggressive growth. More float means less need to borrow. MELI cannot use these funds as they please, though. Banks are bound by law to keep substantial reserves in safe investments, like government bonds. MELI shows a lot of cash restricted for this purpose:
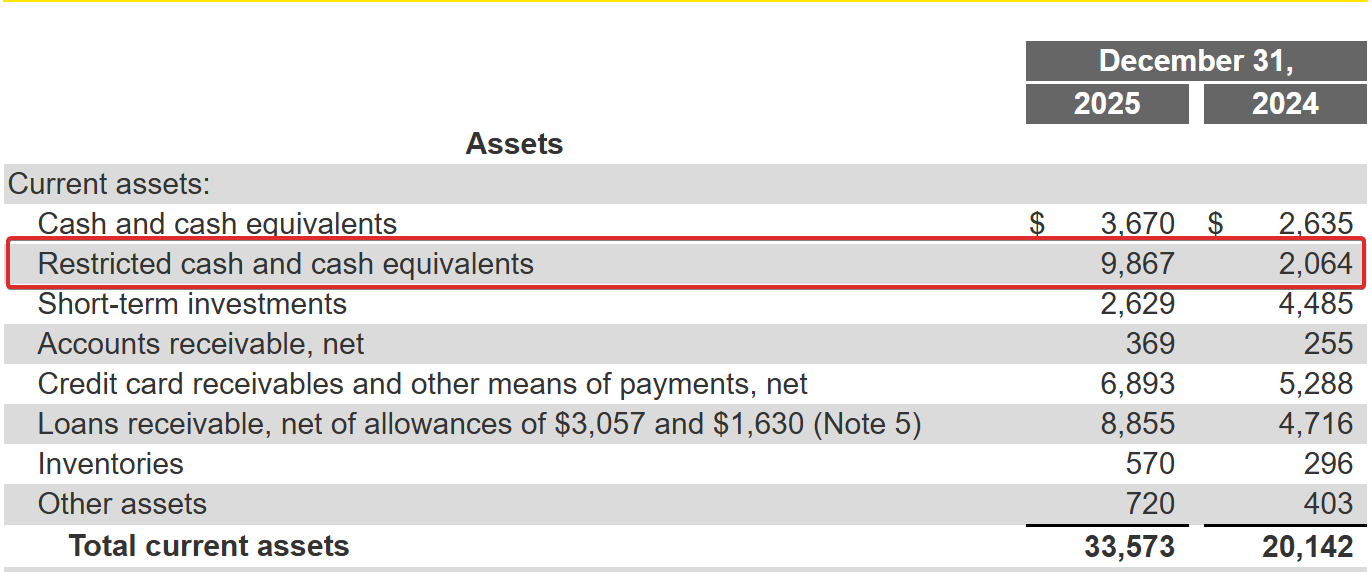
The growth of the float from less than 9B in 2024 to more than 16.5 in 2025 is very impressive, it’s more than 80% year to year. But the amount of restricted cash is growing much faster: from 2B to 9.9B. Almost a 5x increase1!
Still, the company has around 16.5B - 9.9B = 6.6B excess funds to fuel growth. Growth, in turn, boosts float: the more customers you have, the more deposits and transactions you get. That’s one of the reasons why compressing margins for faster growth makes total sense: MELI can partly offset the acquisition cost via excess low-cost liquidity.
If central banks increase restricted cash requirements, MELI’s ability to utilize float will diminish. This is a big risk for the company and we must bake it into our thesis.
Reverse DCF model assumptions
How should we model float in a reverse DCF? I decided to approximate it as an increase in return on invested capital. Float funds assets that would otherwise require investor capital, so subtracting it from IC reveals the return on what investors actually had to contribute.
We have 11.43B of invested capital and 2.25B of NOPAT2, so our return on invested capital is around 20%. If we treat 6.6B of float as offsetting part of invested capital, ROIC jumps to 2.25 / (11.43 − 6.6) = 47%. Wild. That’s the power of float.
It is an oversimplification, of course. Float is not is permanent and not fully available. But it does the job, i.e. translates float into one of the knobs in the DCF we can use to estimate the impact of regulatory pressure.
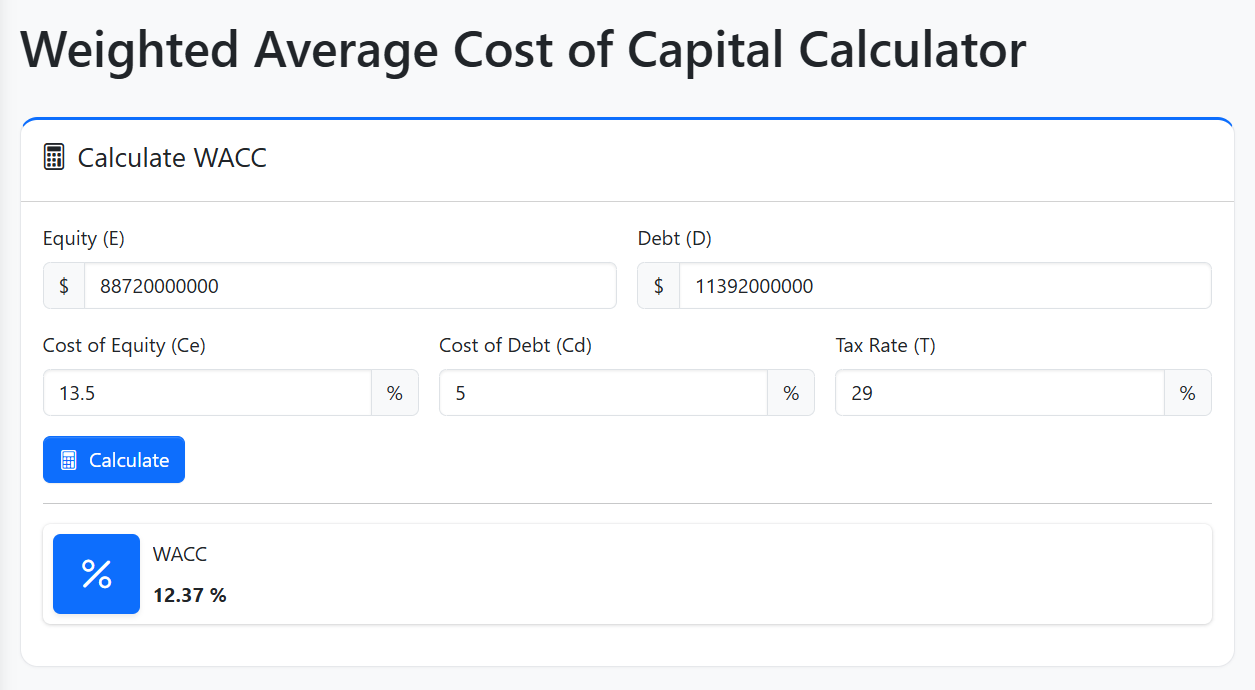
I estimate WACC as 12.4%3.
Base case: what expectations are already priced in at $1750
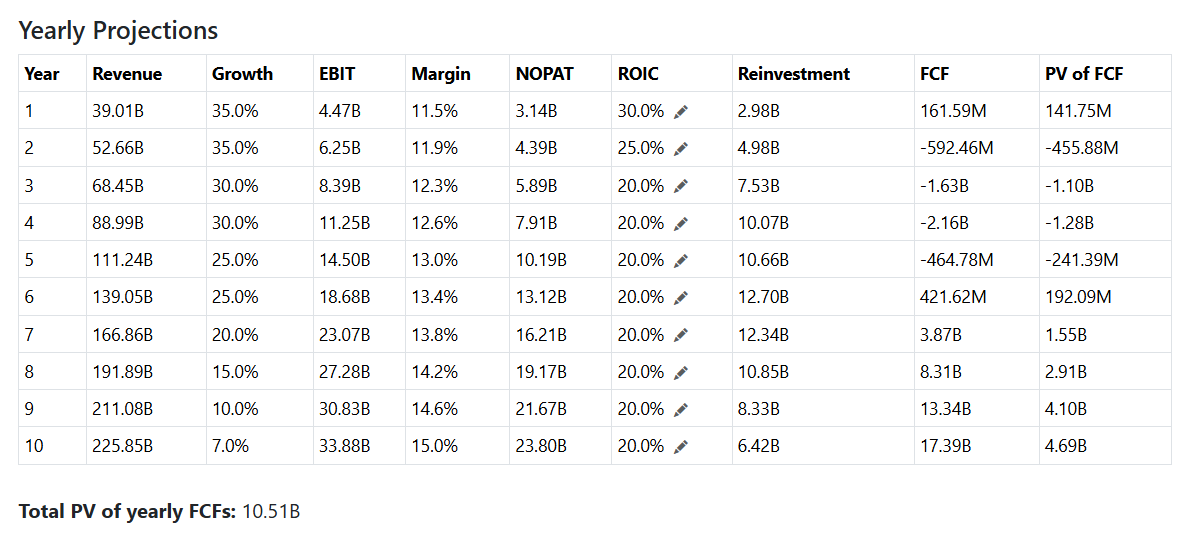
Here is one of the scenarios to reconcile the current enterprise value around 93B and future cash flows:
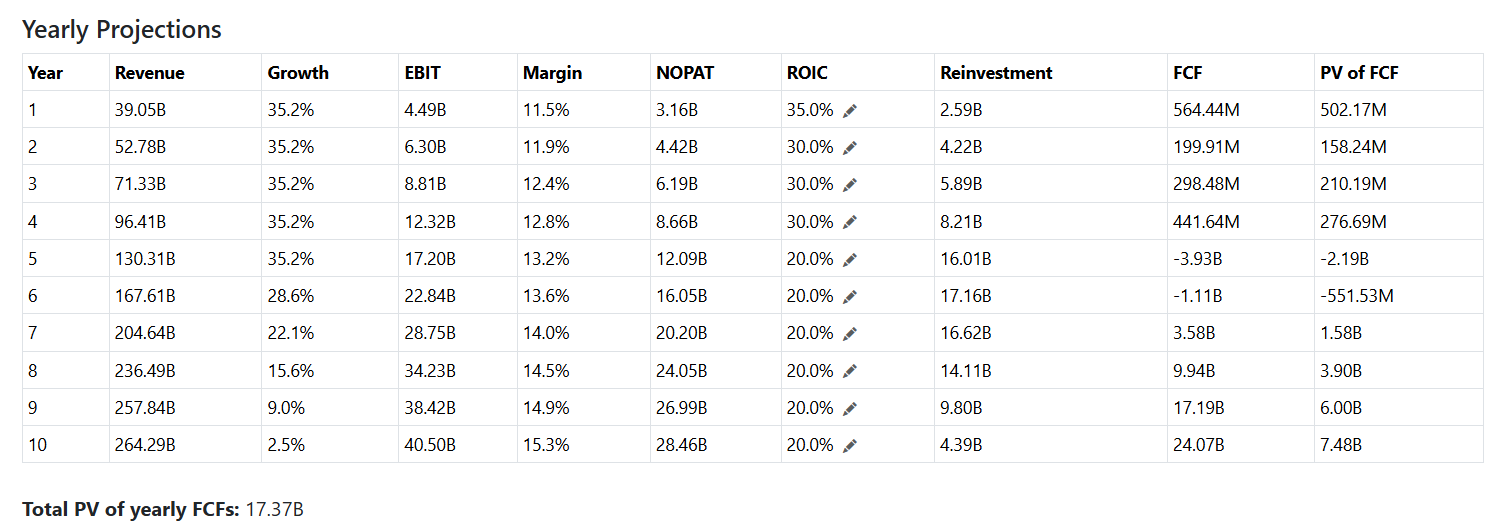
Strong growth for five years, then it fades.
Margin gradually expands to 15%.
ROIC still benefits from float, but on a smaller scale and the effect fades too.
With terminal growth 2.5% and terminal ROIC 14.4%, terminal value dominates.
Note that free cash flow remains fairly weak until the later years.
Bull case
Let’s assume:
Better growth.
Float continues to help on the same scale for a couple of years and the effect fades slower.
Margin also grows to 15%.
Slightly cheaper capital (12% WACC).
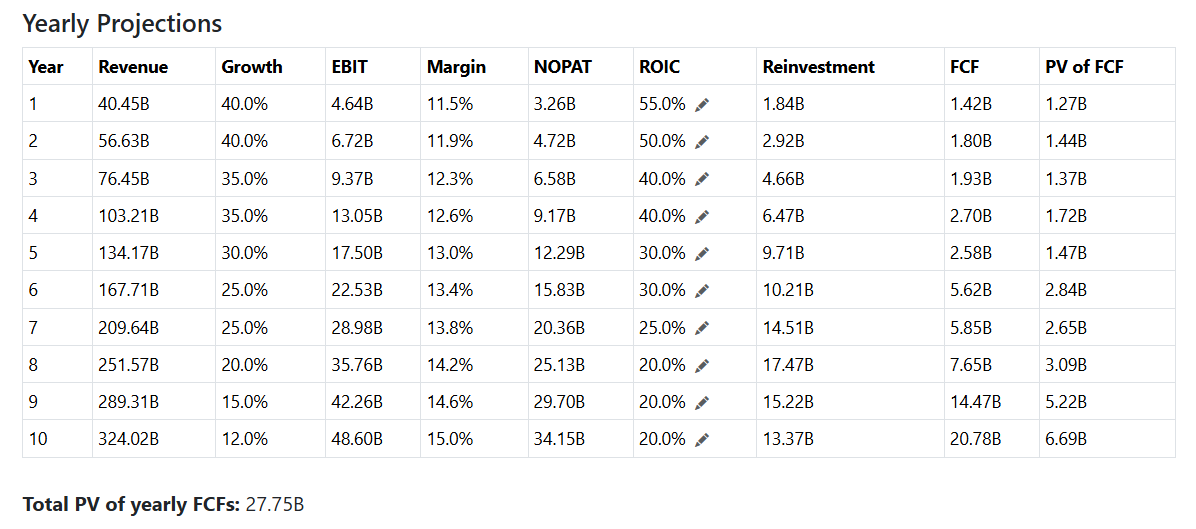
I used 55% ROIC in Year 1 to make FCF close to the adjusted FCF MELI reported for 2025.
In this scenario we are getting 126B enterprise value which means 35% upside and stock price $2356.
Bear case
Assume:
Capital is more expensive (WACC 14%).
Regulators will quickly break the float uplift by restricting more cash.
Slower growth trajectory (the risk is real even if the execution remains excellent: FX reality in LATAM is brutal).
But margin grows to 15% in this case too.
Here we got 59B enterprise value with corresponding downside 37% and stock price $1106.
Probabilities and buy zone logic
Let’s summarize.
Base case: MELI continues compounding, growth gradually fades, but in 10 years it will be a huge business with 265B revenue.
Bull case: MELI keeps its growth on the current level at least for 5 years and simultaneously expands margin; float continues to help for a long time.
Bear case: still strong execution, but macroeconomic and regulatory headwinds cause much weaker growth and return on capital.
What are the probabilities of these scenarios? As usual, that’s the trickiest part where everyone disagrees.
My best guess:
20% bear case. I do not see major company-specific risks right now; the volatile environment is the main danger.
45% base case. The market is right with annoying frequency; I usually give 50% to the base case if there are no real holes in its rationale. In the base model described above, the future already looks somewhat harsh, even 2026 is already materially worse than 2025. So 5% goes to the bull case.
35% (the rest).
Now we can weight the probabilities and their stock prices using weighted scenario calculator:
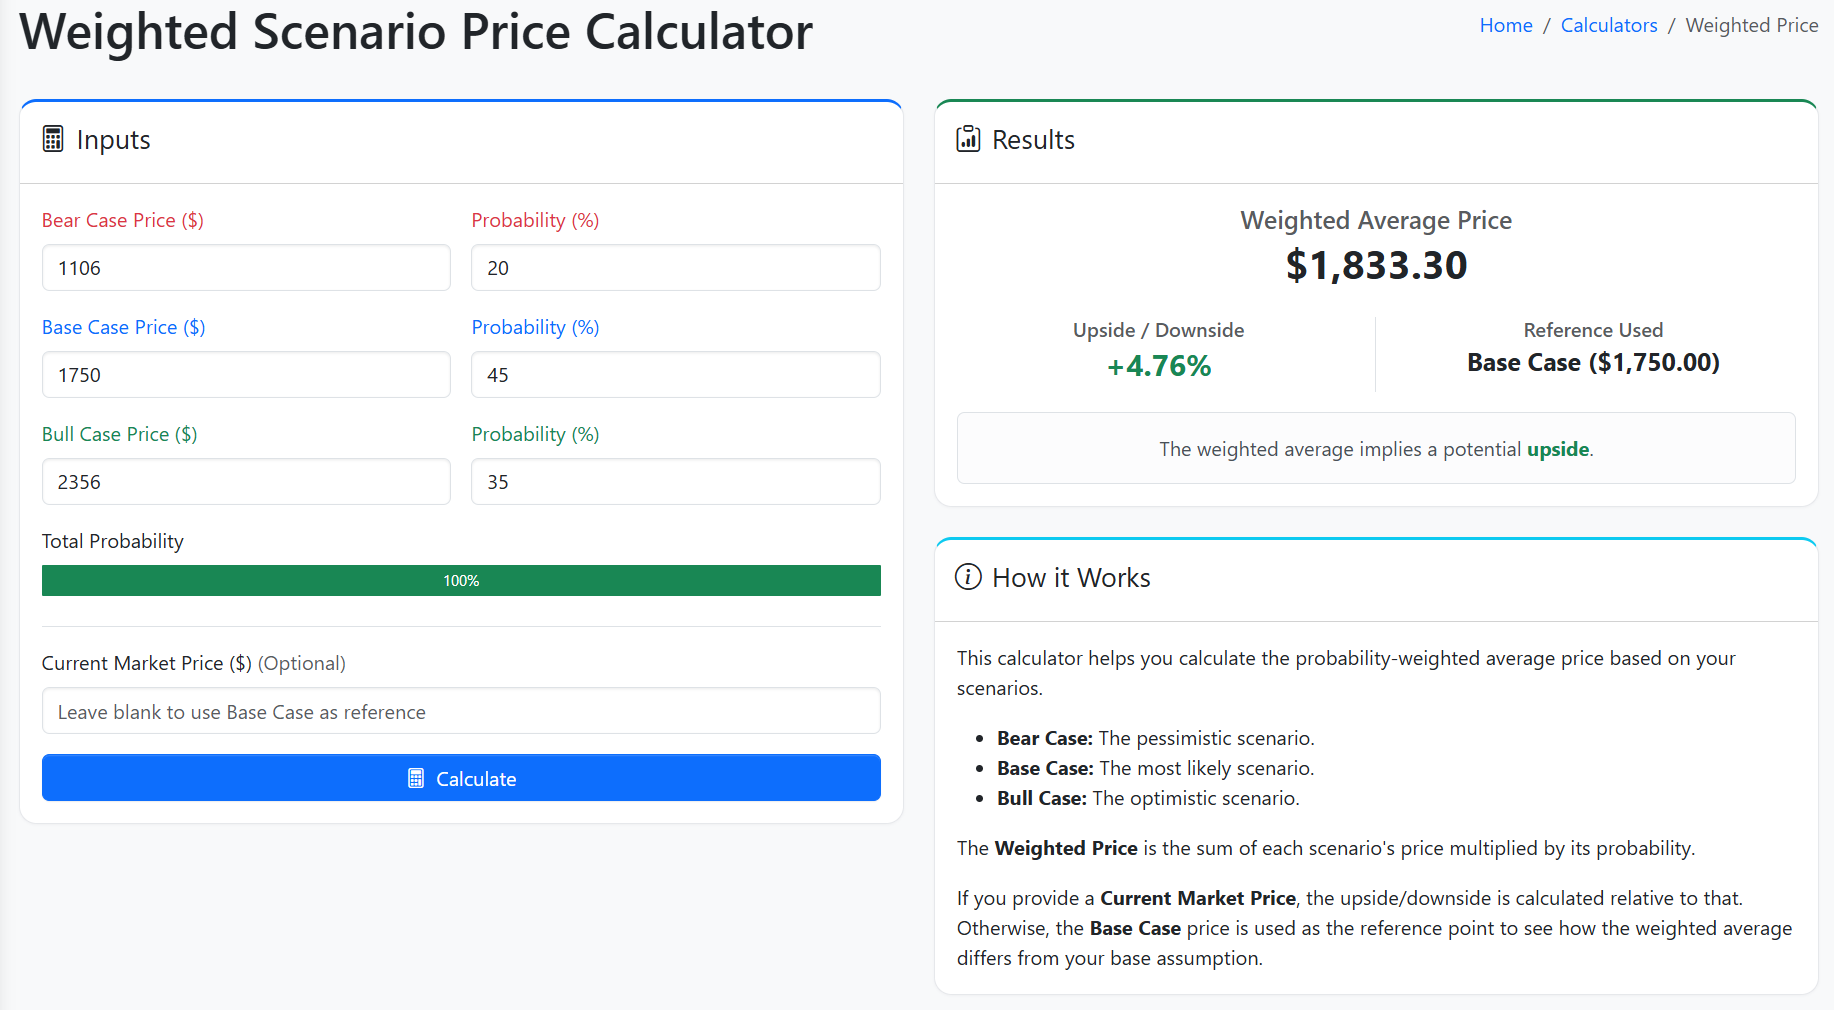
So, the weighted average price is just slightly higher than the current price around $1750. Margin of safety is quite thin, so I still pass. My final take:
1750 (5% implied upside): interesting business, weak edge.
1600 (15%): worth attention.
1500 (22%): expected value starts compensating for uncertainty.
below 1450 (26%): probably compelling if fundamentals are the same.
Note that these numbers are NOT advice, a price target, or a forecast. They are the result of modeling with the assumptions stated above. I made them as part of my own investment process for my own portfolio.
I sincerely invite everyone to poke into the weak spots of the models! I would be happy to get feedback and improve my understanding.
Disclosure: on the publication date I have no positions in MELI, neither long nor short.
This publication is for informational and educational purposes only. It is not investment advice, tax advice, or a recommendation to buy or sell any security. I am not a licensed financial advisor. Investing involves risks, including the possible loss of capital. Always do your own research or consult a professional before making financial decisions.
Mostly due to new regulations that came into force in Brazil:
I use data from the latest 10-K to derive the necessary statistics:
Current annual revenue: 28.89B
Prior annual revenue: 20.78B
Annual operating income (EBIT): 3.20B
Current EBIT margin
Formula: Annual EBIT ÷ Annual revenue
3.20B ÷ 28.89B
Result: 11.1%
NOPAT₀
Formula: Annual EBIT × (1 – effective tax rate)
3.20B × (1 – 29.7%)
Result: 2.25B
Invested capital
Formula: total debt + book equity (parent) + minority interest – cash and equivalents – non-operating assets
11,392,000,000 + 6,748,000,000 + 0 – 6,710,000,000 – 0
Result: 11.43B
ROIC₀
Formula: NOPAT₀ ÷ invested capital
2.25B ÷ 11.43B
Result: 19.7%
Observed growth (Annual)
Formula: (Current annual revenue – Prior annual revenue) ÷ Prior annual revenue
(28,893,000,000 – 20,777,000,000) ÷ 20,777,000,000
Result: 39.1%
First, we need to get cost of equity = risk-free rate + beta × mature market risk premium + country premium. I use Damodaran’s estimate for Brazil risk premium here.
Cost of equity = 3.97 + 1.48 × 4.23 + 3.24 = 13.47.
Then I use my own calculator and to add the impact of debt. I estimated cost of debt as 5% because recently MELI issued bonds with 4.9% yield and it was heavily oversubscribed.
As per our DCF, MELI is just slightly undervalued.
Thanks for the great post!
I think MELI is one of the most interesting stocks in the market today! Great upside.