
Undervalued growth stocks backtest: how a simple screener crushed the S&P 500
I expected these stocks to lag. They didn’t.

Stock screeners try to identify juicy undervalued stocks using a couple of simple metrics. I was always skeptical about this approach. Finding the future winners just by applying filters like “price-to-earnings < 20”? Really? No reading Form 10-Q, no attention to earnings calls, no understanding of the business context? Too good to be true, right?
Let’s run an honest backtest and find out.
Test portfolio: 25 stocks with rapid earnings growth, low P/E and PEG
I wanted to test a real-life scenario:
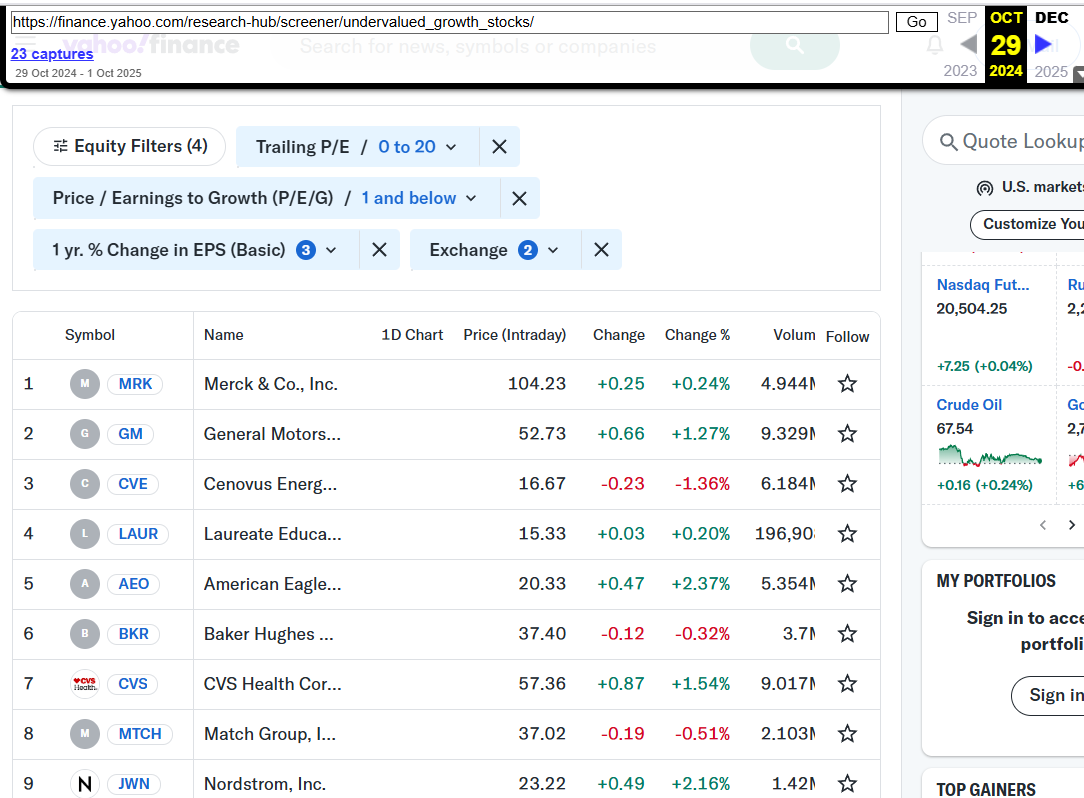
A lazy investor visits the Yahoo Finance Undervalued Growth Stocks page.
Invests $100,000 in 25 companies shown there, $4,000 for each. No additional research — just blindly buying what the screener shows.
No rebalancing; buy and hold.
If this test outperforms the S&P 500, it suggests that the applied filters are sufficient to give valuable insight.
I used Wayback Machine to travel back in time and collect tickers to test:
I hoped web.archive.org had a longer period of history for this page, so I could run multiple tests from different start dates. Sadly, the earliest date is 29 October 2024, so we can run only one near-year-long backtest.
I collected the tickers and ran a Python script that gathers the data about each stock and calculates total performance from 29.10.2024 until 06.10.2025.
I immediately ran into a issue because JWN (Nordstrom) was delisted and became a private company. Shareholders were cashed out.
I adjusted the code to emulate the real-life situation and avoid survivorship bias. The money from the forced sale was evenly distributed among the remaining 24 companies.
And here are the results:
The test portfolio beats the S&P 500 in returns, volatility, Sharpe ratio, and maximum drawdown
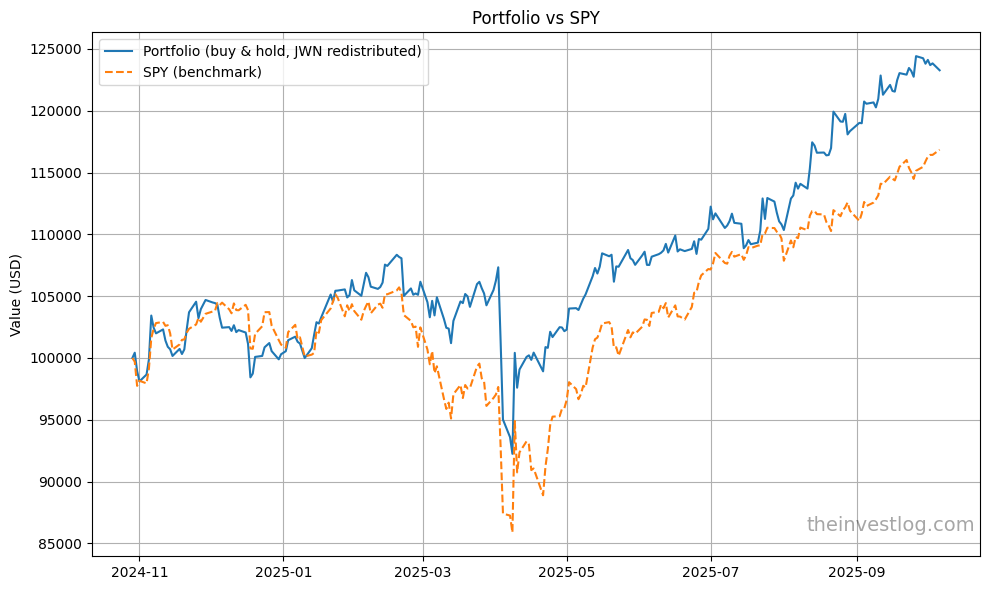
Portfolio
Final value: $123,274.47
Total return: 23.27%
CAGR: 25.02%
Volatility: 19.37%
Sharpe ratio: 1.26
Max drawdown: -14.86%
SPY
Final value: $116,846.00
Total return: 16.85%
CAGR: 18.08%
Volatility: 20.01%
Sharpe ratio: 0.94
Max drawdown: -18.76%
The test portfolio is better by just about every standard metric! I certainly didn’t expect this. My intuition was that returns may be on pair or slightly higher, but so would the volatility. I was thinking along the popular narrative: “the market is stagnant, the growth is fueled by AI-megacaps”.
But here we have strong outperformance from quite a mixed basket (among the TOP-5 winners are finance, retail, education, gold mining).
Here are the files with return data for each stock:
As you can see, the results are quite promising not only in terms of portfolio performance, but also in the selection of the companies. We got:
3 champions (more than 90% return)
6 big winners (more than 35%, twice the S&P 500)
3 winners (outperformed the S&P 500)
4 stocks with positive returns
9 stocks with negative results, among them only one big loser (minus 37%).
Not bad for a naive screener!
Limitations
I did not account for taxes and transaction costs; however, the difference would be insignificant compared to the magnitude of outperformance.
The relatively short period of time (just over 11 months) means the backtest tells very little about how the portfolio performs across regimes.
This could easily be luck. One portfolio, one time period isn’t enough to separate skill from random chance. Testing 20+ different starting dates would be needed to validate whether this screener actually has predictive power.
Conclusions
So far, results are anecdotal but have far exceeded my expectations.
Value combined with growth, even if identified by simple metrics, delivered strong results in both absolute and risk-adjusted terms — at least in the last year’s regime. So screeners focusing on earnings growth, PE and PEG is a promising starting point for stock-picking research.
I am going to analyze the stocks with negative returns from this portfolio in one of my next posts. I want to create heuristics that help avoid buying future losers. Stay tuned!
Update — the following post:
ChatGPT for stock-picking: could simple AI screening improve a portfolio?

Recently I wrote about my backtest of 25 undervalued stocks I picked from an archived stock screener. The results were surprisingly good: the portfolio beat the S&P 500’s annualized return by 7%.
This publication is for informational and educational purposes only. It is not investment advice, tax advice, or a recommendation to buy or sell any security. I am not a licensed financial advisor. Investing involves risks, including the possible loss of capital. Always do your own research or consult a professional before making financial decisions.