
Is META undervalued after the dip?
3-scenario analysis through expectations investing lens

META 0.00%↑ stock plunged after reporting earnings at the end of October 2025. Now it trades around $630; most of this year’s impressive gains are wiped.
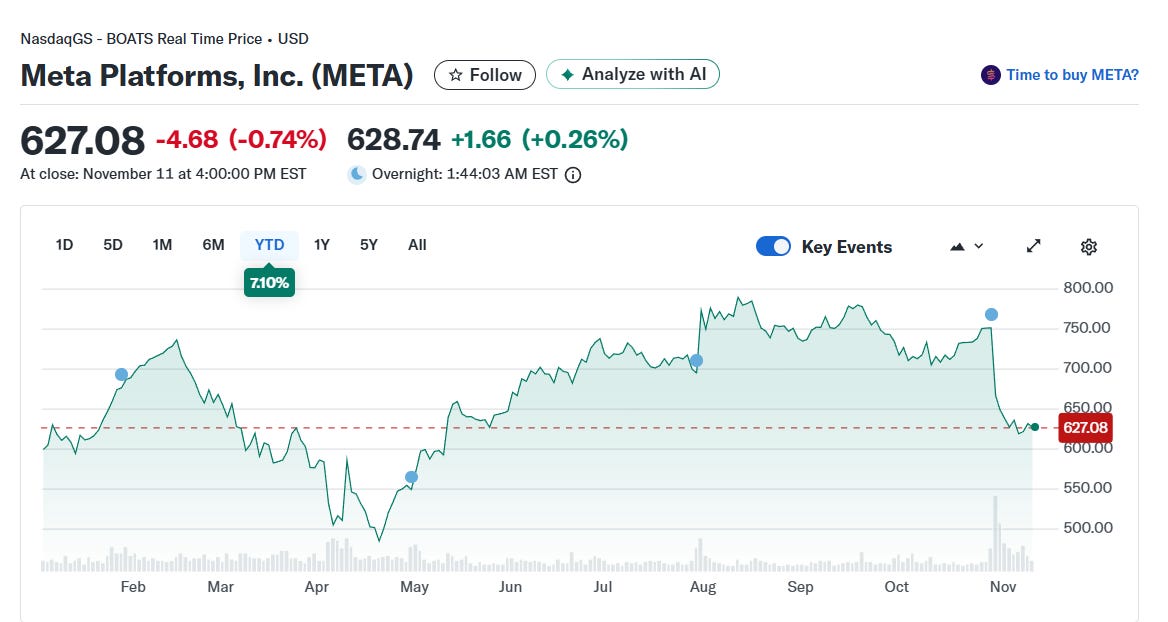
We’ve seen plenty of tech giant recoveries in recent years. Maybe META is also going to rebound soon, giving us a tempting buying opportunity?
Let’s find out.
I gathered the necessary financials1 from 10-Q and 10-K filings, used them to calculate basic performance metrics2, and then constructed 3 models of the company’s future performance.
The idea is simple: to justify a certain price, the company must earn a certain amount of cash in the future. More precisely, the present value of the future cash flows must match the current enterprise value. It is the cornerstone of expectations investing.
Base scenario: “what the market is already paying for”
Let’s model a scenario when the present value of the future cash flows translates precisely into the current price of $630. The corresponding enterprise value is $1.58T3
The standard practice is to assign some growth for 5–10 years and then imagine that the company will will steadily but slowly print cash like a perpetuity (think the eternal savings account).
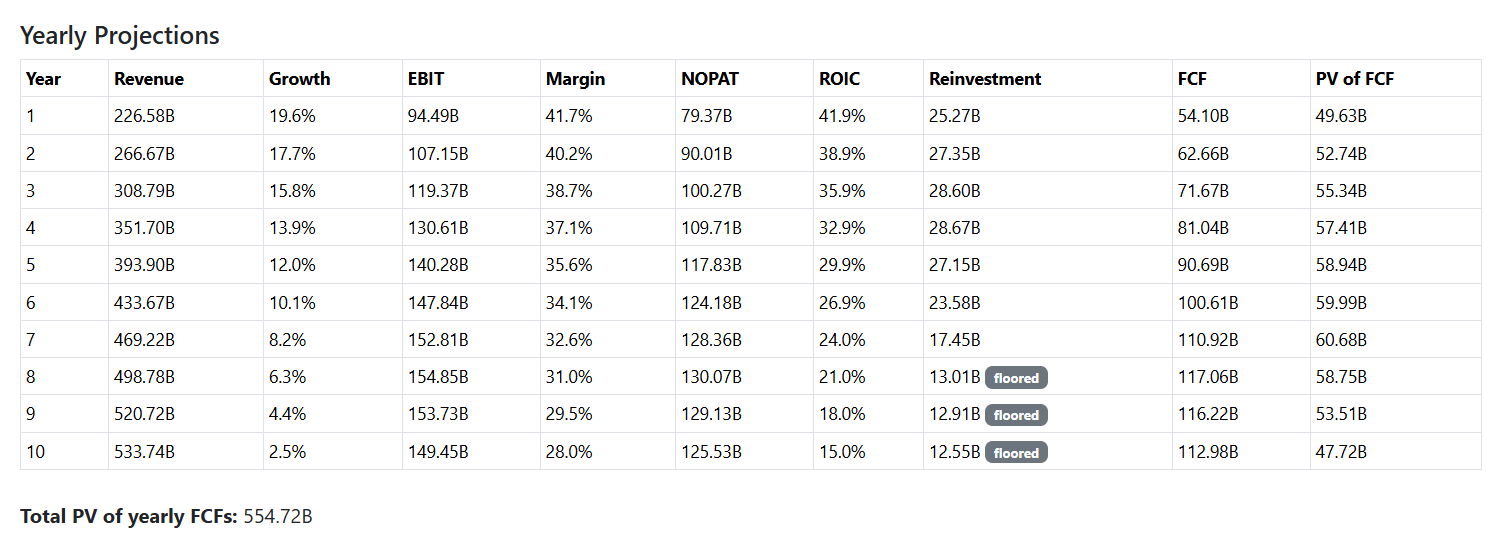
Here is the modeled path for the next 10 years:
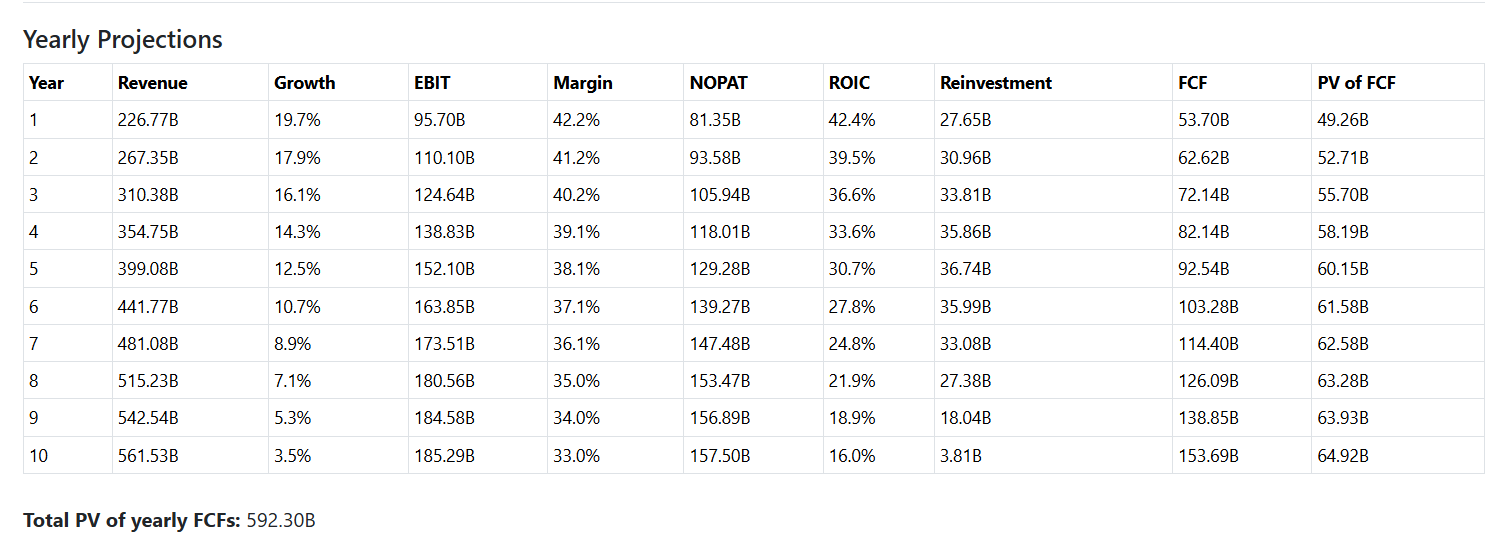
We see a typical path of a maturing company: growth and margin gradually decline, returns on investments decline too, but so does the reinvestment amount. As a result, the company enjoys high free cash flow.
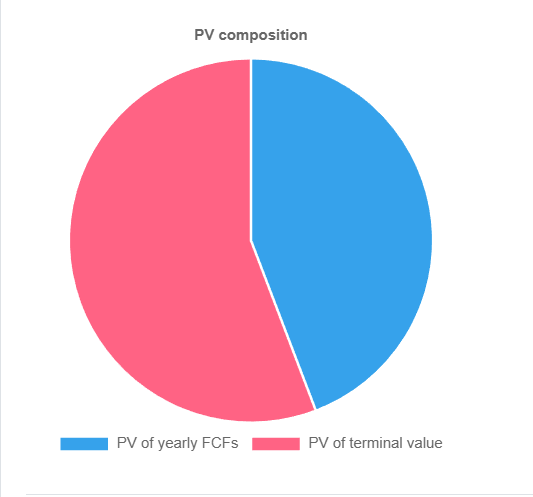
As you see, in that case META would generate ~600B of present value in the next 10 years. Around a trillion is assigned to cash flows from the perpetuity (terminal value):
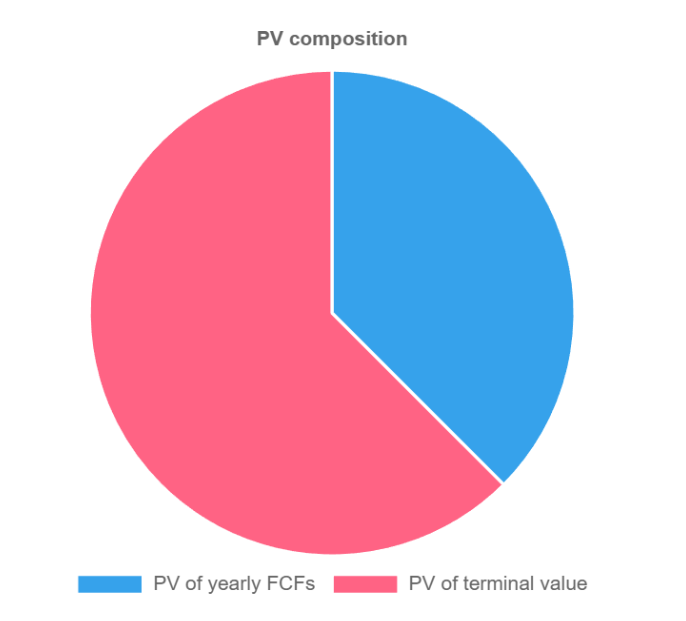
The assumptions I used for the terminal value are pretty favorable: 16% ROIC, 3.5% growth. They might seem modest by the current META standards, but remember, we are talking about the eternal growth, the equivalent of a never-ending savings account.
The market believes that META will be a successful business, able to deliver superior results even after 10 years of decent growth.
Bull case: “everything goes right”
Let’s be generous and assume:
Much higher growth: 19.3% during the next 5 years.
Higher terminal margin: 35% instead of 33% in the previous model.
Reinvestment demand fades quicker.
Lower capital cost (in the previous model I used 9%, now I am setting 8%).
Still generous terminal growth 3,5% and terminal ROIC 16%.
Lower effective tax rate: 14% instead of 15%4.
Here’s our 10-year path:
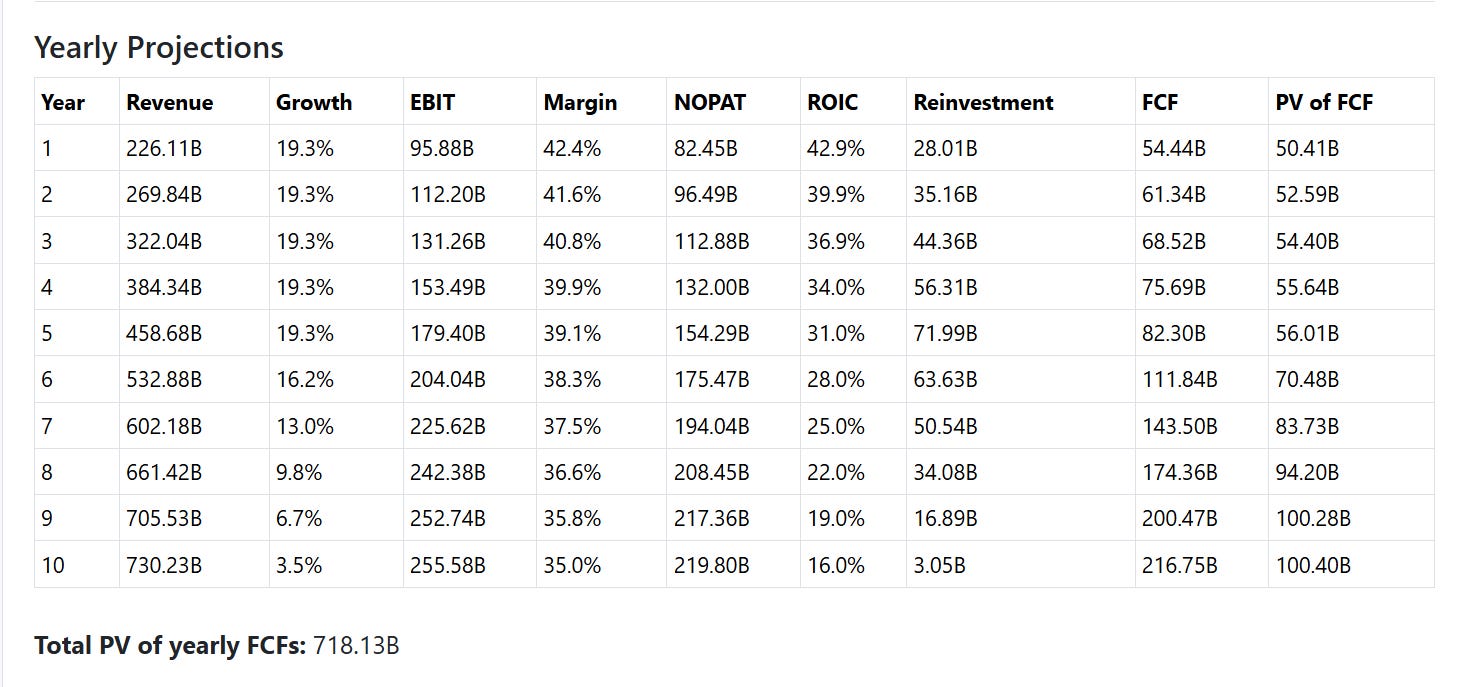
Free cash flow explodes to 200+ billion (four times year one!).
Enterprise value in this scenario is 2.56T, which means 2.56/1.58 = 1.62 or 62% upside.
The corresponding price is 1.62 × $630 = $1020.
Bear case: “ordinary, still good, but not special”
Now we are modeling a harsher scenario. Nothing particularly nasty, just a few tweaks:
9% cost of capital.
2.5% terminal growth.
15% terminal ROIC.
16% effective tax rate.
28% target margin.
The model demands reinvestment to be at least 10% of NOPAT (hard floor).
Growth fades on the same trajectory as in the base scenario, but to 2.5%, not 3.5%, because it is our new terminal growth rate.
Here is the 10-year path:
Still tons of cash. Still, it is a very good business, still a huge terminal value:
Enterprise value is 1.25T, which means 20.6% downside and translates into a $500 stock price.
Weighting the cases to get the price target
Current market price implies that META will grow at a double-digit rate for 6 years, gradually maturing. Margins go down from exceptional 40+ to moderate 30+. A long future as a successful, stable money-printing machine after 10 years.
Bull case implies growth to $700B in revenue and keeping high margins — 35% at the 10th year and steady returns after 10 years at the same juicy (for a mature business) rate. We still need to compress margins somewhat because the guidance indicates higher CAPEX.
Bear case implies slower growth trajectory, worse margins, and 2.5% terminal rate of return. Still, the company grows to to $500B+ in annual revenue in ten years.
In terms of business operations:
Bull case: META finds additional revenue streams, like WhatsApp monetization or hardware. It is hard to imagine $700B in revenue just by squeezing ads more efficiently. Efficiency has its limits. Significant expansion of the user base is also problematic. META is already a dominant player. It is hard to climb higher when you are already on the summit.
Bear case: moderate overall economic headwinds, failing to reliably monetize new directions, expensive CAPEX, still very powerful ad business.
Base case: as usual, something in between. Meta has some success in new departments, some failures, runs an exceptional ad business, which gradually matures.
How probable is each of this scenarios? It’s the trickiest part where most disagreements live. My assessment is:
Base case: 60% (market scenario looks boring and moderate, minimal assumptions).
Bull case: 20% (distinct possibility, but we need a lot of things stacked in our favor)
Bear case: 20% (the same, a few things must become worse).
I am probably biased against META because haven’t heard strong enough narrative about how and why it would make the bull case a reality. But clearly I could miss something important. So let’s make it 50/30/20, giving the bull case more probability.
Our weighted price will be, then:
0.5×630+0.3×10²⁰+0.2×500 = 721.
That’s 14.5% upside.
Note that this numbers are NOT price target or a forecast. It is the result of modeling with stated above assumptions.
Conclusion
Let’s summarize:
At ~$630 the market is already paying for:
High-double-digit growth for a few years.
Margins drifting down from 40%+ to low 30s (which is plausible in light of growing capital intensity).
A still-good 16% return on capital in perpetuity.
My bull case needs several things to go right (including success of new parts of the business) to get to ~$1,020. My bear case needs harsher economic conditions plus growth to fade a bit faster and margins to land at 28% to get to ~$500.
Probability-weighted, I get ~$720 — about 14–15% above spot. Not exactly the margin of safety I dream of.
That does not mean META cannot be a good investment. It is still possible. But from the models I run, I do not see a mispricing and screaming buy opportunity.
If the price keeps falling while fundamentals stay roughly the same, the three scenarios will start indicating 25–30% upside instead of ~15%. That’s when it turns from “fine company, fully priced” into “buy with a margin of safety.” Still, I prefer my margin of safety to be higher.
That’s my analysis. I made it in my own investment process for my own portfolio from a long-term investing perspective. It is in no way an investment advice; always do your own research.
I sincerely invite everyone to poke into the weak spots of the models! I would be happy to get feedback and improve my understanding.
Disclosure: on the publication date I have no positions in META, nor long, nor short.
This publication is for informational and educational purposes only. It is not investment advice, tax advice, or a recommendation to buy or sell any security. I am not a licensed financial advisor. Investing involves risks, including the possible loss of capital. Always do your own research or consult a professional before making financial decisions.
Here are the numbers I used. If you spotted a mistake or inconsistency, please let me know!
Number of shares: 2572000000 (Shares used in computation of diluted EPS, Three Months Ended September 30, 2025, 10-Q).
Total debt: 28830000000 (The carrying amount of our long-term debt in the form of fixed-rate senior unsecured notes (the Notes) was $28.83 billion as of September 30, 2025, 10-Q).
Cash and cash equivalents 10187000000 (10-Q).
Marketable securities 34261000000 (10-Q).
Total non-marketable equity investments 25074000000 (10-Q).
Total revenue 2024 164501000000 (10-K).
Revenue YTD (9 months): 141073000000 (10-Q).
Revenue YTD (previous 9 months): 116116000000 (10-Q).
Income from operations YTD (9 months) 58531000000 (10-Q).
Income from operations YTD (previous 9 months) 46016000000 (10-Q).
Income from operations (2024) 69380000000 (10-K).
Total stockholders’ equity 194066000000 (10-Q).
Here are the necessary calculations:
TTM revenue
Formula: annual revenue + current ytd revenue – prior ytd revenue
Inputs: 164,501,000,000 + 141,073,000,000 – 116,116,000,000
Result: 189.46B
TTM operating income (EBIT)
Formula: annual ebit + current ytd ebit – prior ytd ebit
Inputs: 69,380,000,000 + 58,531,000,000 – 46,016,000,000
Result: 81.89B
Current EBIT margin
Formula: ttm ebit ÷ ttm revenue
Inputs: 81.89B ÷ 189.46B
Result: 43.2%
NOPAT₀
Formula: ttm ebit × (1 – effective tax rate)
Inputs: 81.89B × (1 – 15.0%)
Result: 69.61B
Invested capital
Formula: total debt + book equity parent + minority interest – cash and equivalents – non operating assets
Inputs: 28,830,000,000 + 194,066,000,000 + 0 – 10,187,000,000 – 59,335,000,000
Result: 153.37B
ROIC₀
Formula: NOPAT₀ ÷ invested capital
Inputs: 69.61B ÷ 153.37B
Result: 45.4%
Observed growth (TTM)
Formula: (current ytd revenue – prior ytd revenue) ÷ prior ytd revenue
Inputs: (141,073,000,000 – 116,116,000,000) ÷ 116,116,000,000
Result: 21.5%
Market cap
Formula: price per share × diluted shares
630 × 2,572,000,000
Result: 1.62T
Enterprise value
Formula: market cap + total debt + minority interest – cash and equivalents – non operating assets
1,620,360,000,000 + 28,830,000,000 + 0 – 10,187,000,000 – 59,335,000,000
Result: 1.58T
There was a lot of fuss about tax adjustments in the recent earrings. The situation is clear when you read the report: “Provision for income taxes includes a one-time, non-cash income tax charge of $15.93 billion accrued in the third quarter of 2025, related to the implementation of the One Big Beautiful Bill Act. Excluding this one-time tax charge, our third quarter 2025 effective tax rate would have decreased by 73 percentage points to 14%, compared to the reported effective tax rate of 87%.”. I still used 15% in the long-term neutral scenario, based on the company Q4 2025 guidance (12–15%) and ongoing rollout of 15% global minimum.
Your transition from a 40%+ EBIT margin to a low-30s terminal margin is a sobering but likely realistic take on the capital intensity required for the AI arms race.
Regarding your Bull Case ($1,020): To hit that $700B revenue target, how much weight are you giving to the "Family of Apps" core vs. new hardware/Metaverse cycles? Specifically, do you think WhatsApp monetization could scale fast enough to offset the potential plateauing of ad-load on Instagram and FB?
Clean framework. One fix: your terminal (g=3.5%, ROIC=16%) implies ~22% retention (g/ROIC). If AI capex keeps retention higher, base FCF/payout is lower → fair value compresses.